Monthly Housing Update
A comprehensive overview of monthly property sales activity for the Greater Houston area as recorded in the MLS.
Multiple Listing Service of the Houston Association of REALTORS® includes residential properties and new homes listed by 50,000 REALTORS®
HOUSTON’S OCTOBER HOME SALES REFLECT ONGOING EFFECTS OF BLOATED MORTGAGE RATES
Despite another sales decline, the market approaches year-end with healthy indicators
HOUSTON — (November 8, 2023) — The Houston real estate market continues to be hamstrung by the highest mortgage rates in two decades as consumers take most of their business to the rental sector. October marked the 19th straight month of negative home sales, however there are healthy indicators layered throughout the latest statistics as the final quarter of 2023 began.
According to the Houston Association of Realtors’ (HAR) October 2023 Market Update, single-family home sales across Greater Houston fell 3.4 percent, the lowest monthly rate of decline all year. During October, the Houston Multiple Listing Service (MLS) recorded sales of 6,377 units compared to 6,603 in October 2022. Months supply of homes climbed to 3.6, matching a level last seen in November 2019. Compared to pre-pandemic October 2019, when volume totaled 7,187, home sales were down 11.3 percent.
The low and high ends of the market saw positive sales activity while homes priced between $150,000 and $1M experienced modest declines of between 4.3 and 8.5 percent. Rentals of single-family homes and townhomes/condominiums remained strong. HAR will publish its October 2023 Rental Home Update next Wednesday, November 15.
“The Houston real estate market had an encore performance of slower home sales and solid rental activity in October and we can probably expect those trends to prevail for the rest of the year,” said HAR Chair Cathy Treviño with LPT, Realty. “Housing inventory has grown steadily in recent months and pricing has moderated, so any notable decline in mortgage rates will likely spark renewed interest in homebuying, but only the Fed can control whether that happens.”
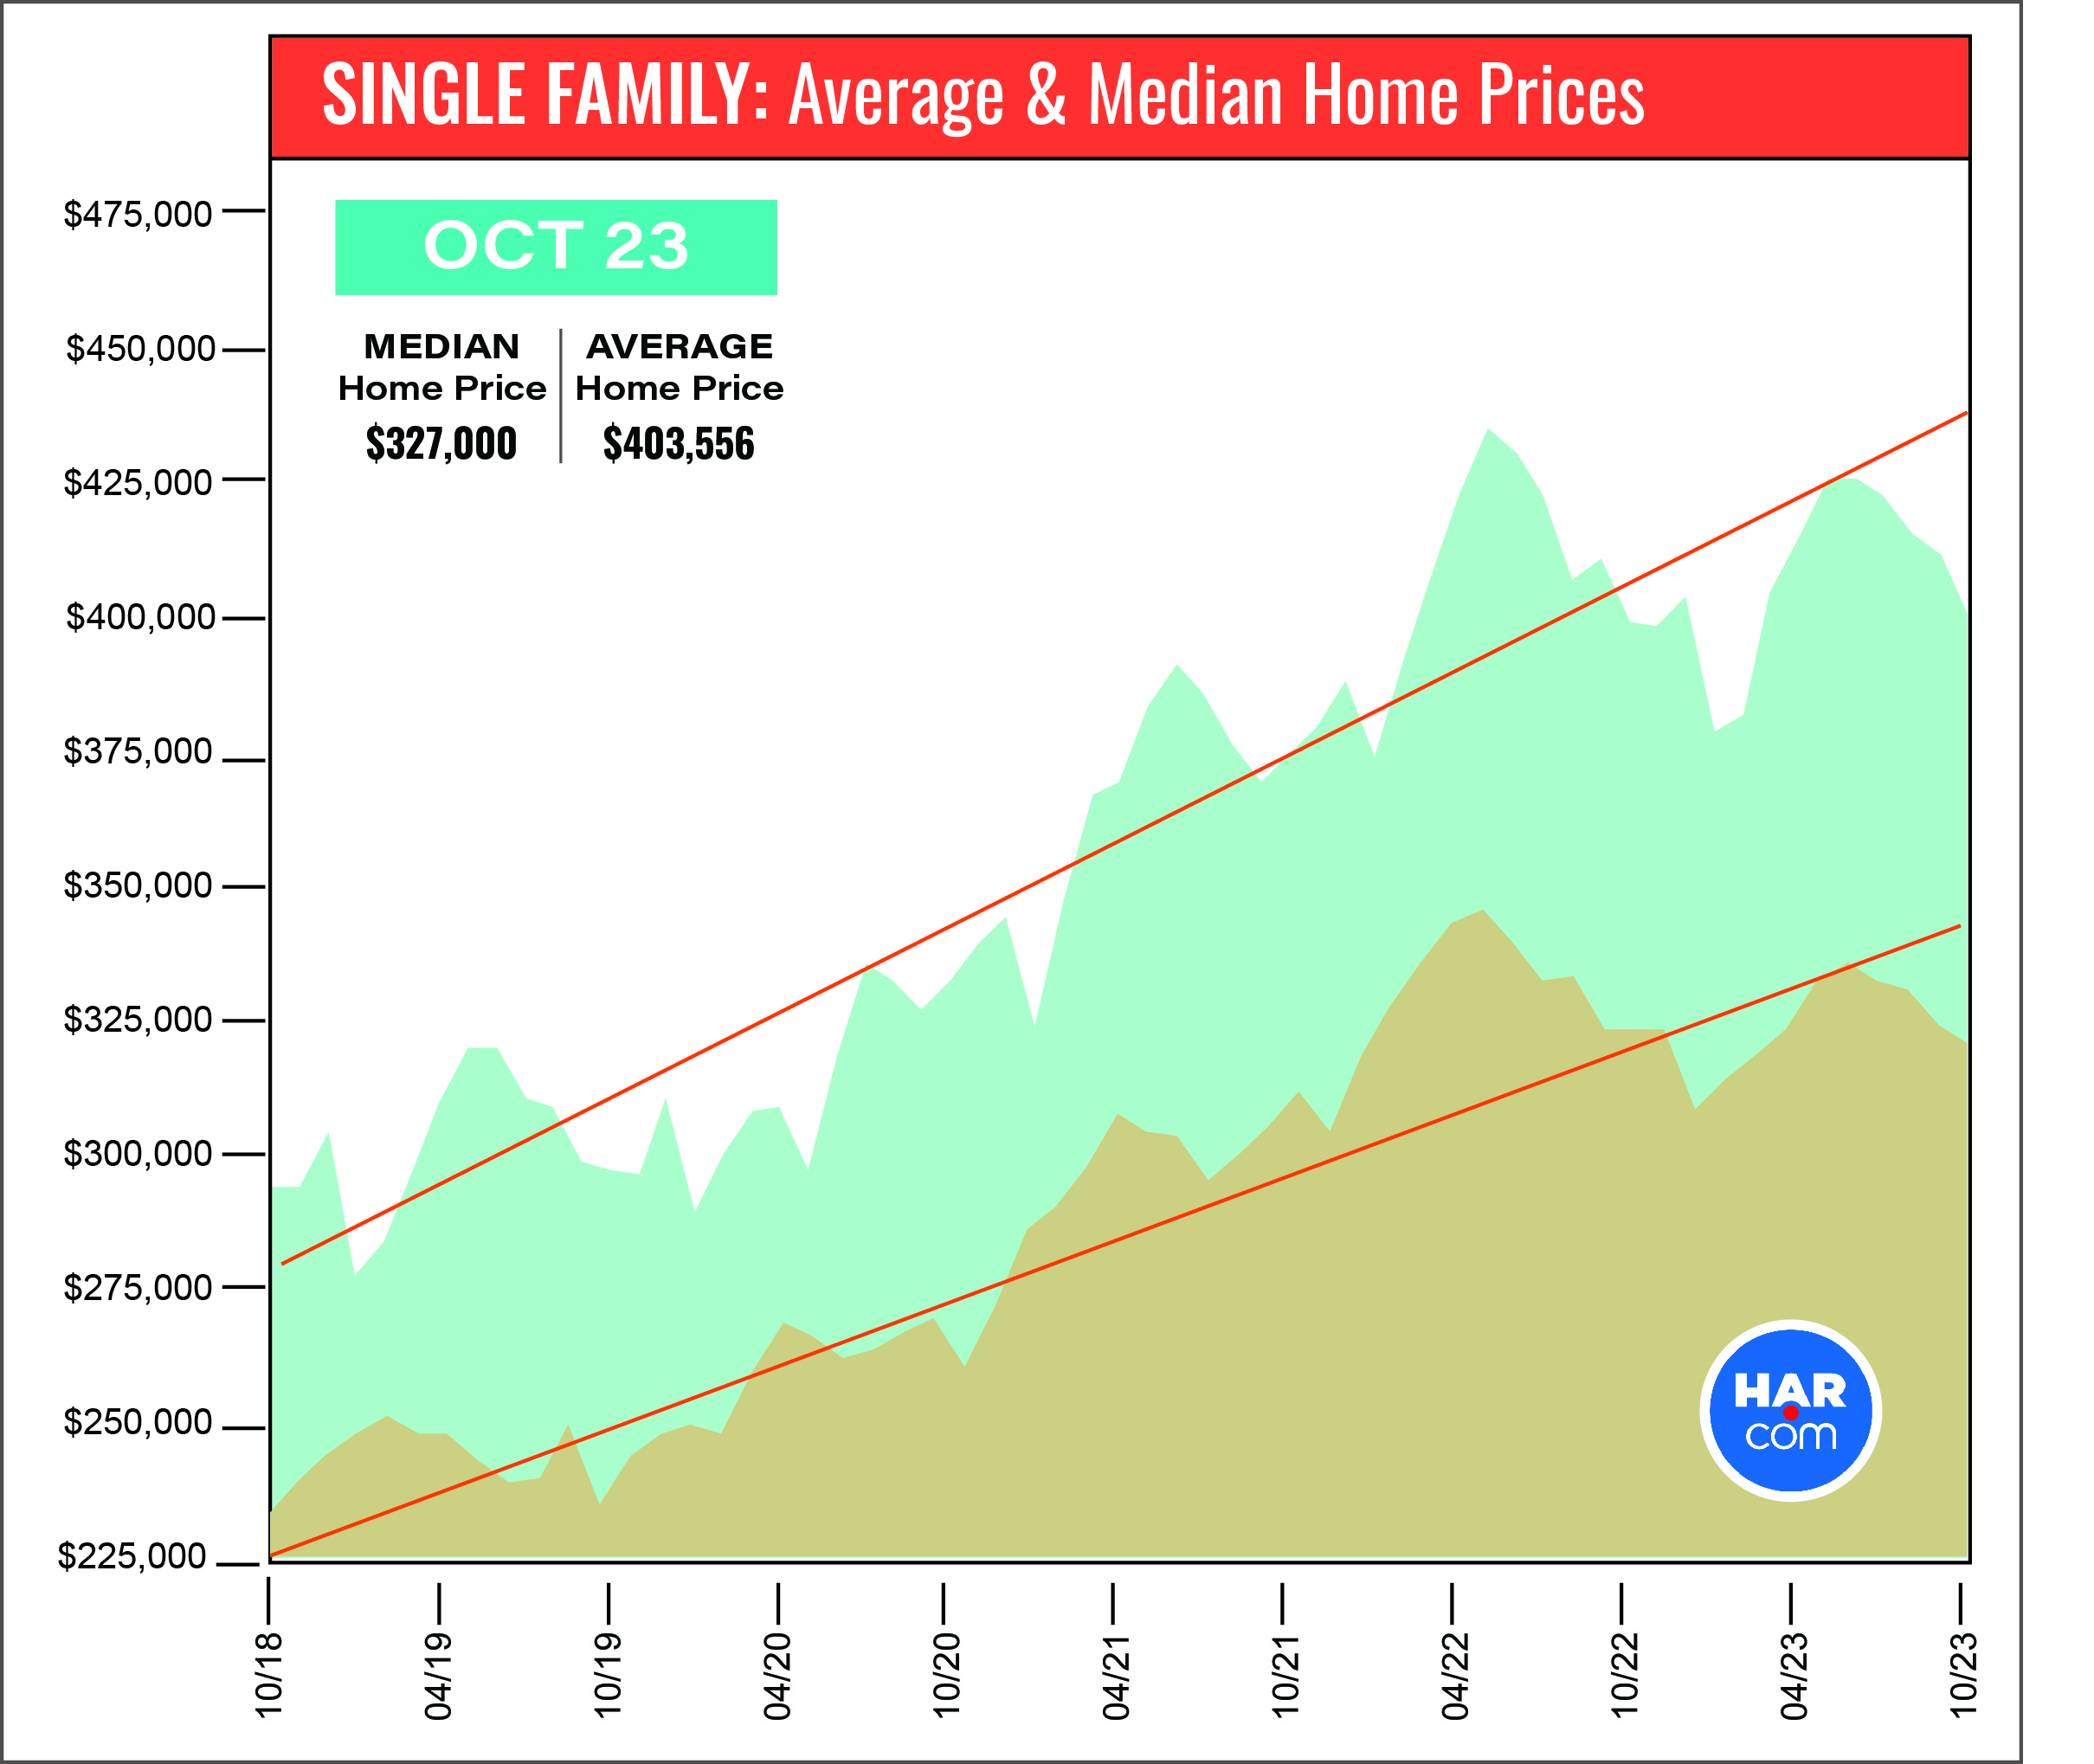
Single-family home prices continue to moderate. The average price edged up just 0.4 percent to $403,556 while the median price declined 0.9 percent to $327,000. Those figures are significantly below the record highs of $438,350 (average) in May 2022 and $354,000 (median) in June 2022.
October Monthly Market Comparison
October marked the 19th consecutive month of negative sales activity with year-over-year single-family home sales down 3.4 percent. That is the smallest monthly volume decline of 2023. When compared to pre-pandemic October 2019, sales were down 11.3 percent and when stacked against the sales volume in October 2018, five years ago, sales were down 4.6 percent.
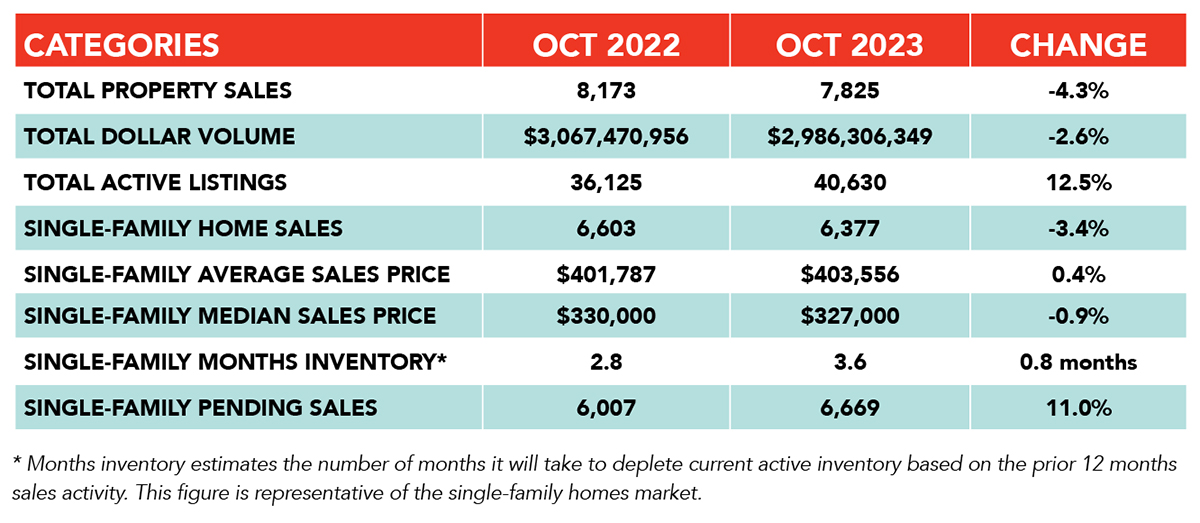
In addition to the decline in single-family sales volume, total property sales and total dollar volume also fell below last year’s levels. Total dollar volume was $2.98 billion, down from $3.06 billion a year earlier. Single-family pending sales rose 11.0 percent. Active listings, or the total number of available properties, were 12.5 percent ahead of the 2022 level.
Months of inventory expanded in October to a 3.6-months supply, matching a level not seen since November 2019. Housing inventory nationally is at a 3.4-months supply, according to the latest report from the National Association of Realtors (NAR). A 4.0- to 6.0-months supply is generally considered a “balanced market” in which neither buyer nor seller has an advantage.
Single-Family Homes Update
Single-family home sales declined 3.4 percent year-over-year in October with 6,377 units sold across the Greater Houston area compared to 6,603 in 2022. Pricing continues to ease after reaching record highs last spring. The October average price rose a fractional 0.4 percent to $403,556 while the median price fell a fractional 0.9 percent to $327,000.
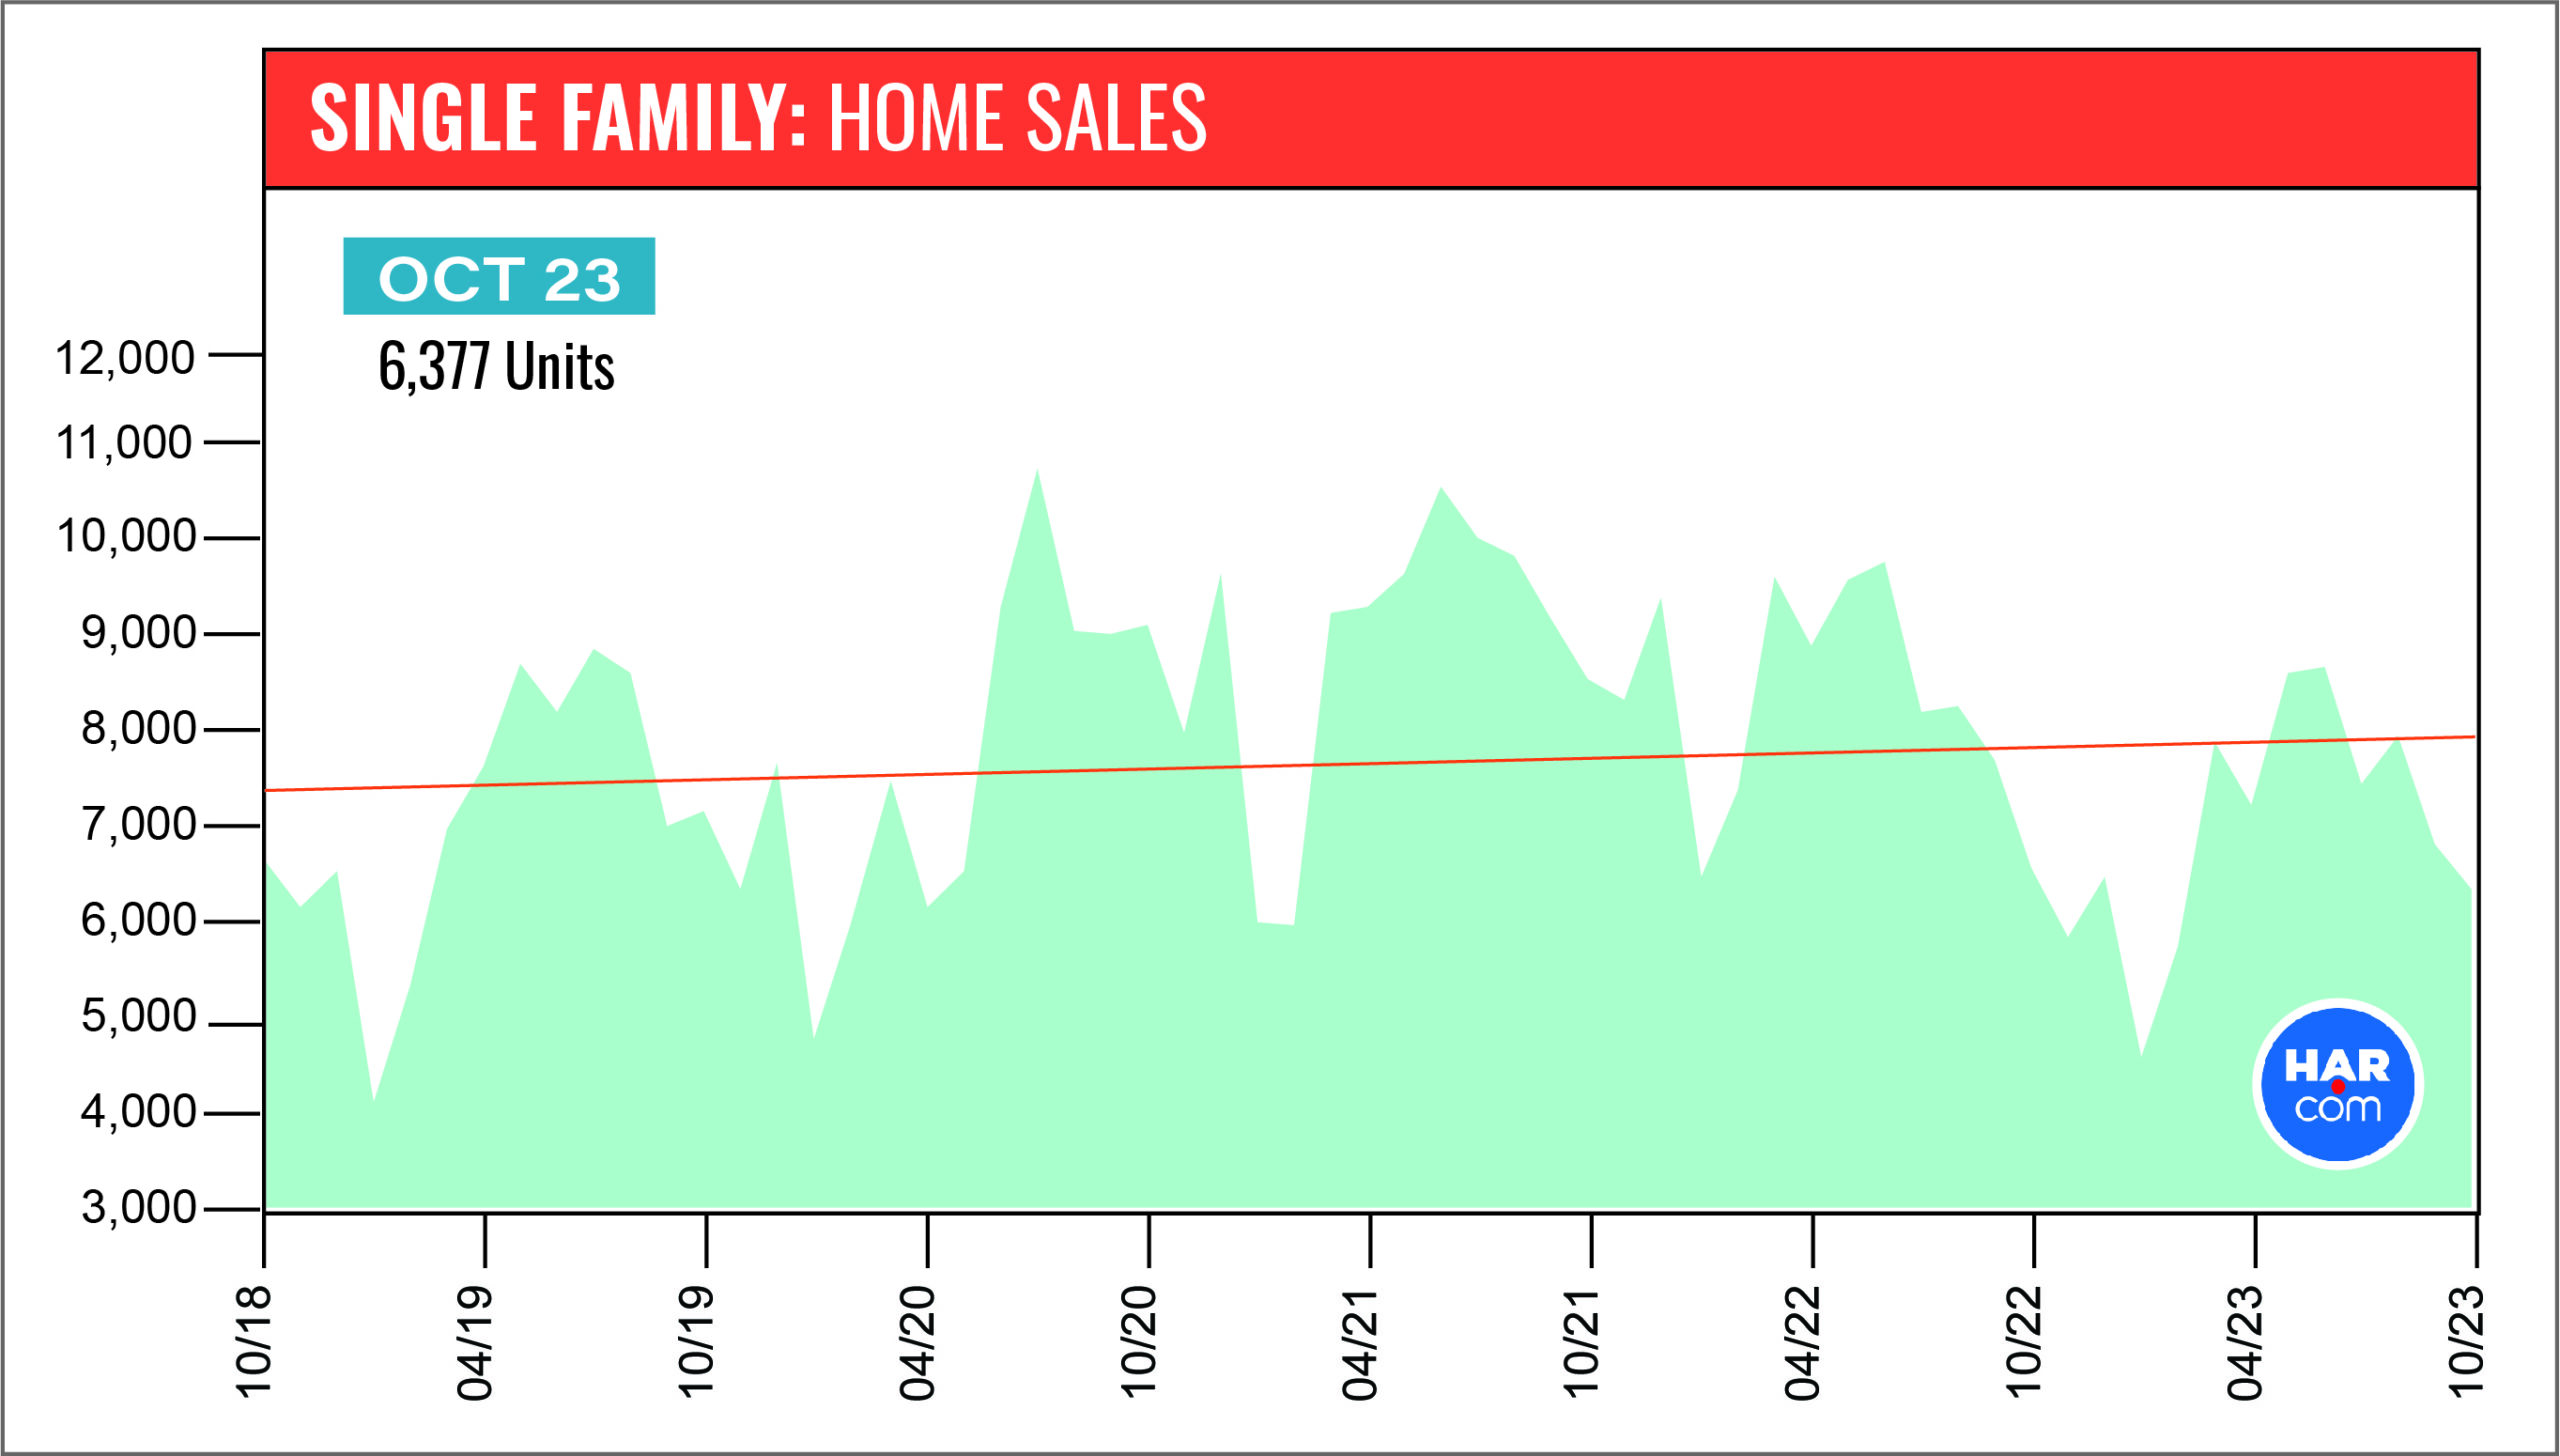
For a pre-pandemic perspective, October closings were 11.3 percent below October 2019’s total of 7,187. The October 2023 median price of $327,000 is 36.3 percent above its 2019 level ($240,000), and today’s average price of $403,556 is 35.3 percent higher than it was then ($298,158). Sales are 4.6 percent below where they were five years ago, in October 2018, when volume totaled 6,687. Back then, the median price was $235,000 and the average price was $294,572.
.
Days on Market, or the actual time it took to sell a home, increased from 43 to 47 days. Months of inventory registered a 3.6-months supply compared to 2.8 months a year earlier. That is the greatest months supply in four years. The current national supply stands at 3.4 months, as reported by NAR.
Broken out by housing segment, October sales performed as follows:
- $1 - $99,999: increased 12.7 percen
- $100,000 - $149,999: increased 3.1 percent
- $150,000 - $249,999: decreased 4.3 percent
- $250,000 - $499,999: decreased 4.5 percent
- $500,000 - $999,999: decreased 8.5 percent
- $1M and above: increased 21.3 percent
HAR also breaks out sales figures for existing single-family homes. Existing home sales totaled 4,610 in October, down 6.5 percent from the same month last year. The average price rose 3.0 percent to $406,277 and the median sales price rose a fractional 0.9 percent to $318,000.
For HAR’s Monthly Activity Snapshot (MAS) of the October 2023 trends, please click HERE to access a downloadable PDF file.
Townhouse/Condominium Update
The townhouse and condominium market continues to struggle, experiencing its 17th consecutive monthly decline in October. Sales volume fell 16.4 percent year-over-year with 453 closed sales versus 542 a year earlier. The average price edged up 1.2 percent to $272,597 and the median price rose 6.6 percent to $239,900. Inventory grew from a 2.0-months supply to 3.7 months, the highest level since November 2020.
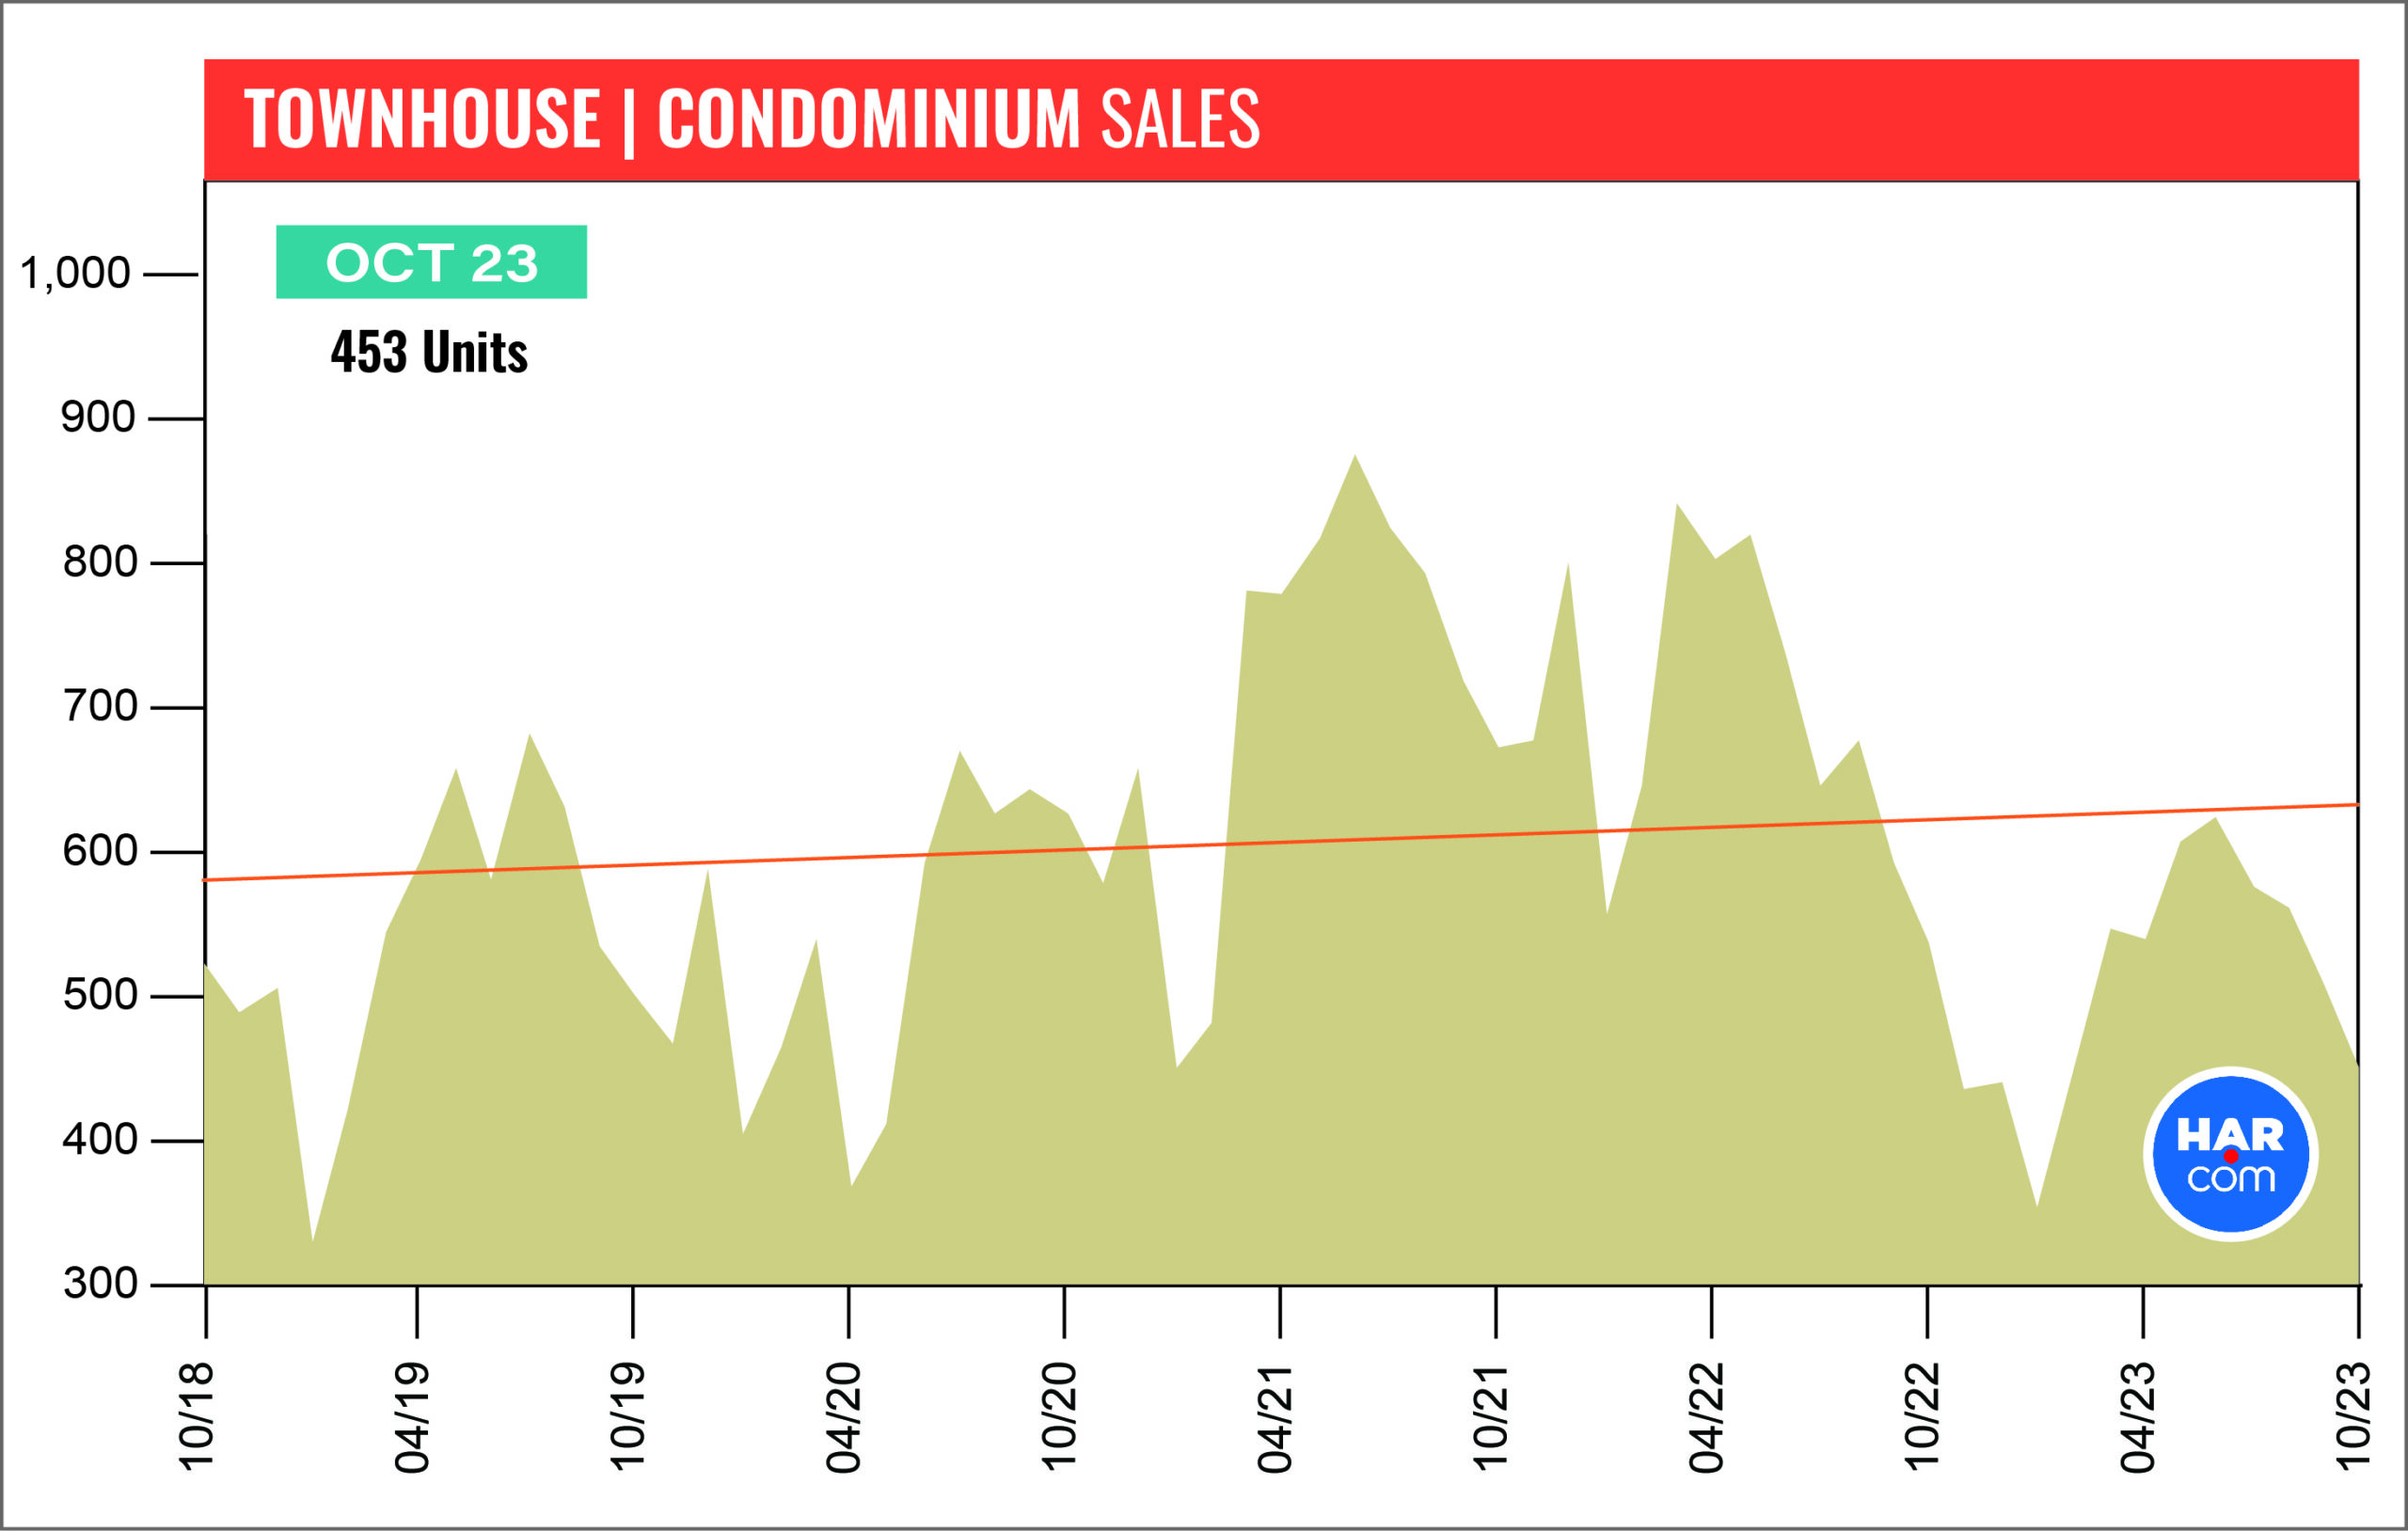
Compared to pre-pandemic October 2019, when 506 units sold, townhome and condominium sales were down 10.5 percent. The average price back then was $198,865 and the median price was $164,500.
Houston Real Estate Highlights in October
- Single-family home sales fell 3.4 percent year-over-year, the smallest one-month sales drop of 2023 and the 19th consecutive month of declines;
- Compared to October 2019, before the pandemic, sales were down 11.3 percent, and compared to October 2018, five years back, they were down 4.6 percent;
- Days on Market (DOM) for single-family homes rose from 43 to 47 days;
- Total property sales fell 4.3 percent with 7,825 units sold;
- Total dollar volume dropped 2.6 percent to $2.98 billion;
- The single-family median price fell a fractional 0.9 percent to $327,000;
- The single-family average price rose a fractional 0.4 percent to $403,556;
- Single-family home months of inventory registered a 3.6-months supply, up from 2.8 months a year earlier – the highest level since November 2019 when it also was 3.6 months;
- Townhome/condominium sales experienced their 17th straight monthly decline, falling 16.4 percent, with the median price up 6.6 percent to $239,900 and the average price up 1.2 percent to $272,597;
- Compared to pre-pandemic 2019, townhome and condominium sales were down 10.5 percent.

