Monthly Housing Update
A comprehensive overview of monthly property sales activity for the Greater Houston area as recorded in the MLS.
Multiple Listing Service of the Houston Association of REALTORS® includes residential properties and new homes listed by 50,000 REALTORS®
THE HOUSTON HOUSING MARKET REMAINS STEADY IN JUNE
Leading indicators show improvement
HOUSTON — (July 12, 2023) — Home sales across Greater Houston were down for a 15th straight month in June, however signs of improvement have begun to appear as showings and pending home sales outpace 2022 trends.
According to the Houston Association of Realtors’ (HAR) June 2023 Market Update, single-family home sales were down 12.8 percent year-over-year with 8,582 units sold compared to 9,845 in June 2022. When stacked up against pre-pandemic June 2019, however, home sales were up 3.9 percent. Months supply of homes climbed to 3.1, the highest level since June 2020.
Homes priced at $1M and above saw their first gain in months, climbing nearly six percent in June. On the other end of the spectrum, sales of homes priced below $150,000 also landed in positive territory with other segments experiencing declines. Rentals of single-family homes and townhomes/condominiums were strong. HAR will publish its June 2023 Rental Home Update next Wednesday, July 19.
“We are seeing improvement after more than a year of negative home sales due largely to rising interest rates and inflation/recession jitters among consumers,” said HAR Chair Cathy Treviño with Side, Inc. “While the Houston real estate market is finally operating at a more normal pace, we need to understand that any volatility in the national economy, including more signs of inflation, could set us back again.”
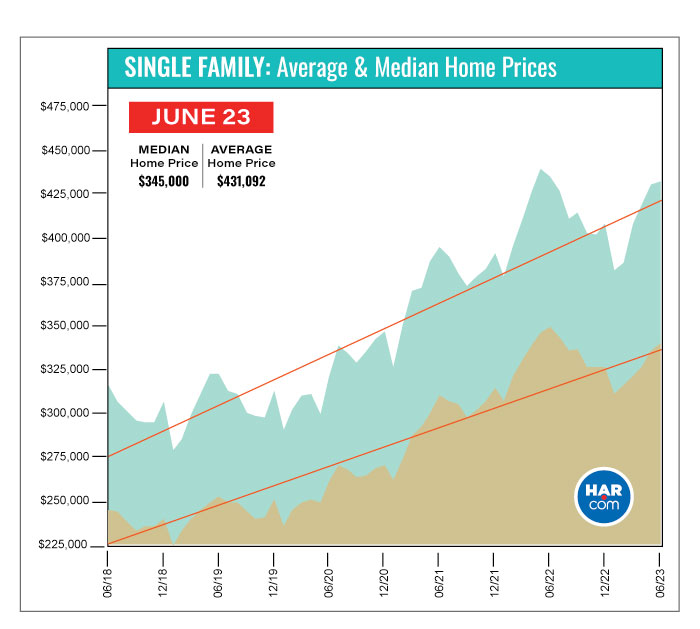
Single-family home prices declined for the fifth time since the spring of 2020. The average price edged down 0.5 percent at $431,092 while the median price fell 2.5 percent to $345,000. That keeps pricing below the record highs of $438,350 (average) in May 2022 and $354,000 (median) in June 2022.
June Monthly Market Comparison
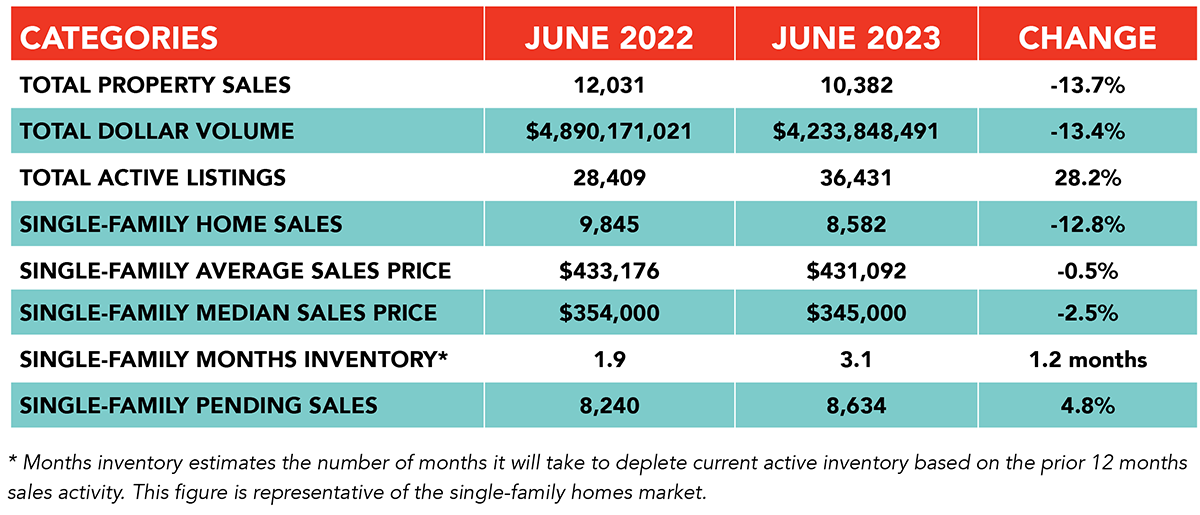
June was the 15th straight month of negative sales as Houston. Year-over-year single-family home sales fell 12.8 percent, but when compared to June 2019, before the pandemic, sales were up 3.9 percent, and compared to June 2018, five years back, they were up 2.3 percent.
In addition to the decline in single-family sales volume, total property sales and total dollar volume also fell below last year’s levels. Total dollar volume was $4.2 billion, down from $4.9 billion a year earlier. Single-family pending sales rose 4.8 percent. Active listings, or the total number of available properties, came in 28.2 percent ahead of the 2022 level.
Months of inventory increased in June, expanding to a 3.1-months supply. That is the greatest months supply since June 2020 when it was 3.0 months. Housing inventory nationally sits at a 3.0-months supply, according to the latest report from the National Association of Realtors (NAR). A 4.0- to 6.0-months supply has traditionally been considered a “balanced market” in which neither buyer nor seller has an advantage.
Single-Family Homes Update
Single-family home sales fell 12.8 percent year-over-year in June with 8,582 units sold across the Greater Houston area compared to 9,845 in 2022. Pricing continues to stabilize after soaring to record highs last spring. The June average price fell 0.5 percent to $431,092 while the median price dropped 2.5 percent to $345,000. February 2023 marked the first pricing declines the Houston housing market had seen in more than two years.
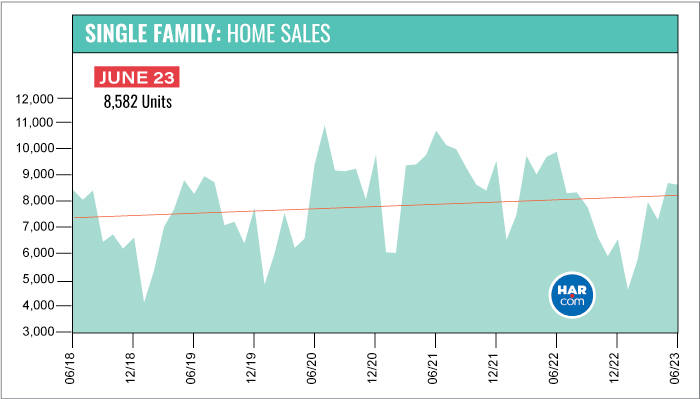
For a pre-pandemic perspective, June closings came in 3.9 percent ahead of June 2019’s tally of 8,249. The June 2023 median price of $345,000 is 36.4 percent higher than it was in 2019 ($253,000) and today’s average price of $431,092 is 34.1 percent higher than it was then ($321,390). Sales are 2.3 percent ahead of where they were five years ago, in June 2018, when volume totaled 8,385. Back then, the median price was $245,000 and the average price was $315,517.
Days on Market, or the actual time it took to sell a home, increased from 28 to 45 days. Months of inventory registered a 3.1-months supply compared to 1.9 months a year earlier. The current national supply stands at 3.0 months, as reported by NAR.
Broken out by housing segment, June sales performed as follows:
- $1 - $99,999: increased 1.1 percent
- $100,000 - $149,999: increased 1.1 percent
- $150,000 - $249,999: decreased 1.1 percent
- $250,000 - $499,999: FLAT
- $500,000 - $999,999: decreased 2.5 percent
- $1M and above: increased 5.9 percent
HAR also breaks out sales figures for existing single-family homes. Existing home sales totaled 6,536 in June, down 16.4 percent from the same month last year. The average price was unchanged at $434,999 and the median sales price declined 2.9 percent to $340,000.
For HAR’s Monthly Activity Snapshot (MAS) of the June 2023 trends, please click HERE to access a downloadable PDF file.
Townhouse/Condominium Update
Townhouses and condominiums experienced their 13th consecutive monthly decline in June, falling 17.5 percent year-over-year with 617 closed sales versus 748 a year earlier. The average price fell 2.7 percent to $252,845 and the median price dropped 2.5 percent to $217,000. Inventory grew from a 1.6-months supply to 2.8 months, the highest level since March 2021.
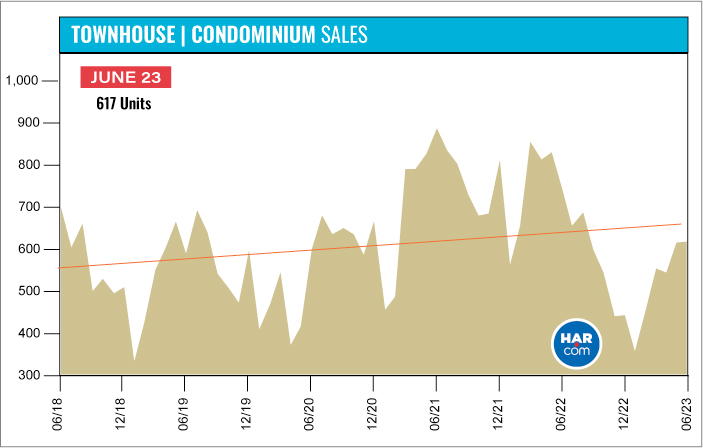
Compared to pre-pandemic June 2019, when 587 units sold, townhome and condominium sales were up 5.1 percent. The average price back then, at $224,365, was 11.3 percent lower and the median price, at $171,604 was 21.0 percent lower.
Houston Real Estate Highlights in June
- Single-family home sales were down 12.8 percent year-over-year, the 15th consecutive month of slowing sales volume, however there were signs of overall improvement to the local housing market;
- Compared to pre-pandemic 2019, single-family home sales were up 3.9 percent and were up 2.3 percent versus the volume five years ago, in June 2018;
- The luxury segment, consisting of homes priced from $1M and above, saw its first gains in months, climbing 5.9 percent year-over-year in June;
- Days on Market (DOM) for single-family homes rose from 28 to 45 days;
- Total property sales fell 13.7 percent with 10,382 units sold;
- Total dollar volume dropped 13.4 percent to $4.2 billion;
- The single-family median price dropped 2.5 percent to $345,000;
- The single-family average price fell 0.5 percent to $431,092;
- Single-family home months of inventory registered a 3.1-months supply, up from 1.9 months a year earlier – the biggest supply in three years;
- Townhome/condominium sales experienced their 13th straight monthly decline, falling 17.5 percent, with the median price down 2.5 percent to $217,000 and the average price down 2.7 percent to $252,845;
- Compared to pre-pandemic 2019, townhome and condominium sales were up 5.1 percent.

