Sold Price Range: $285,001 - $325,000
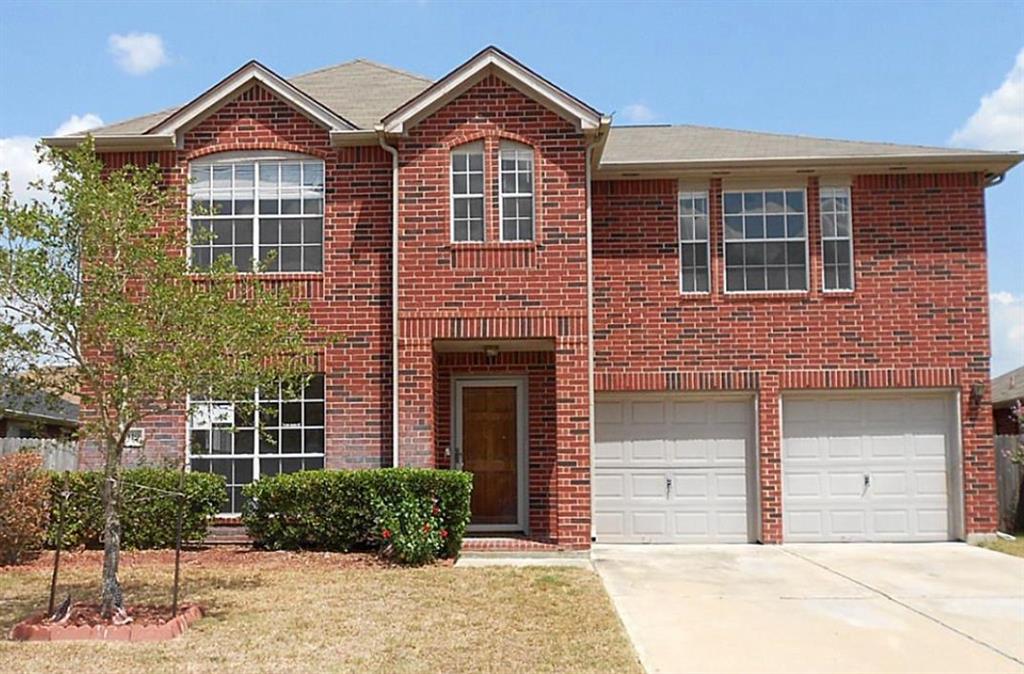
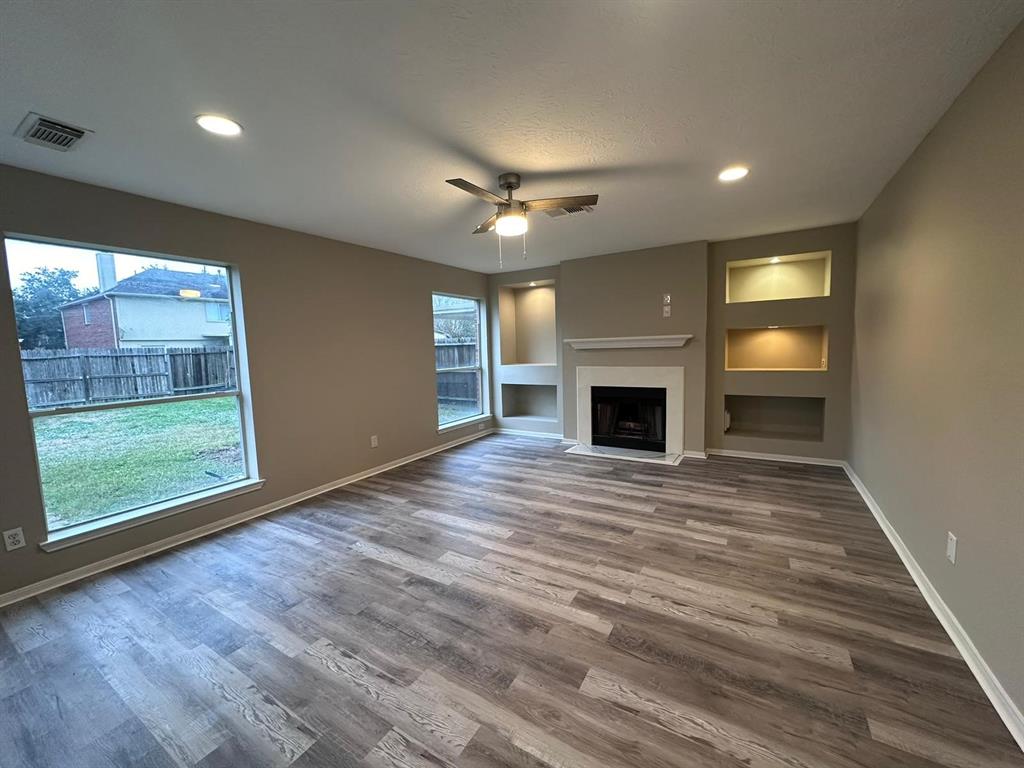
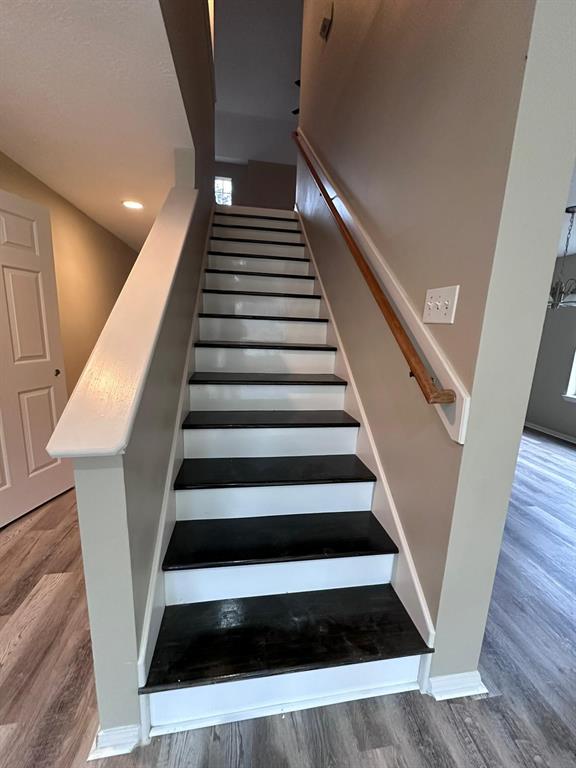
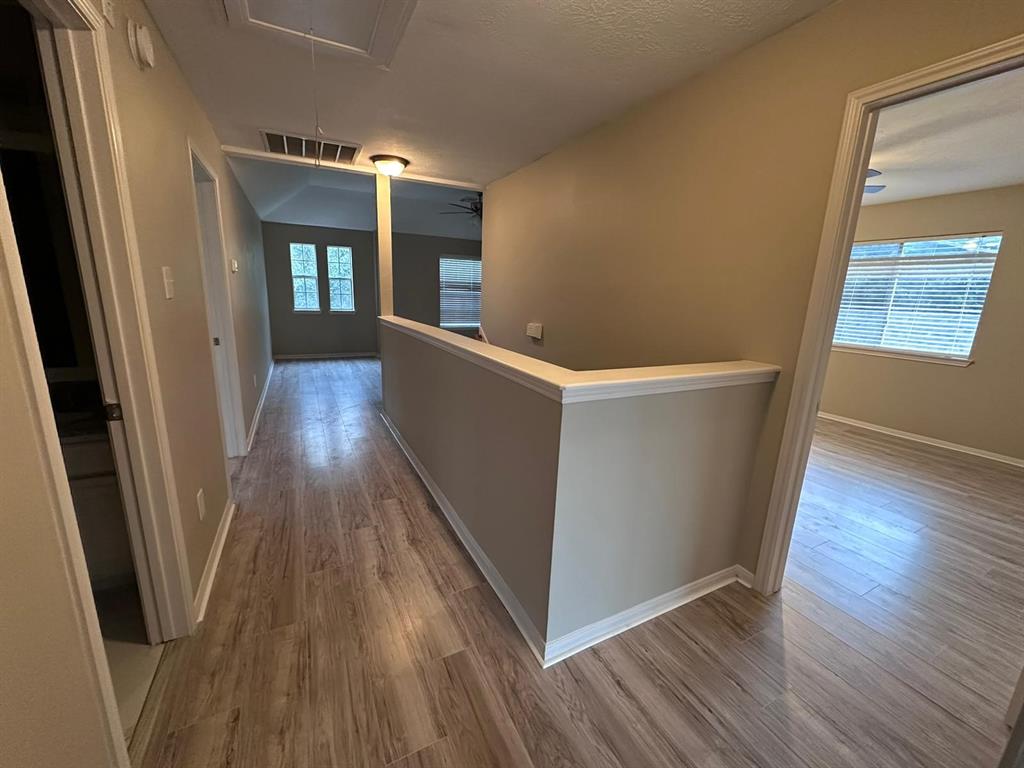
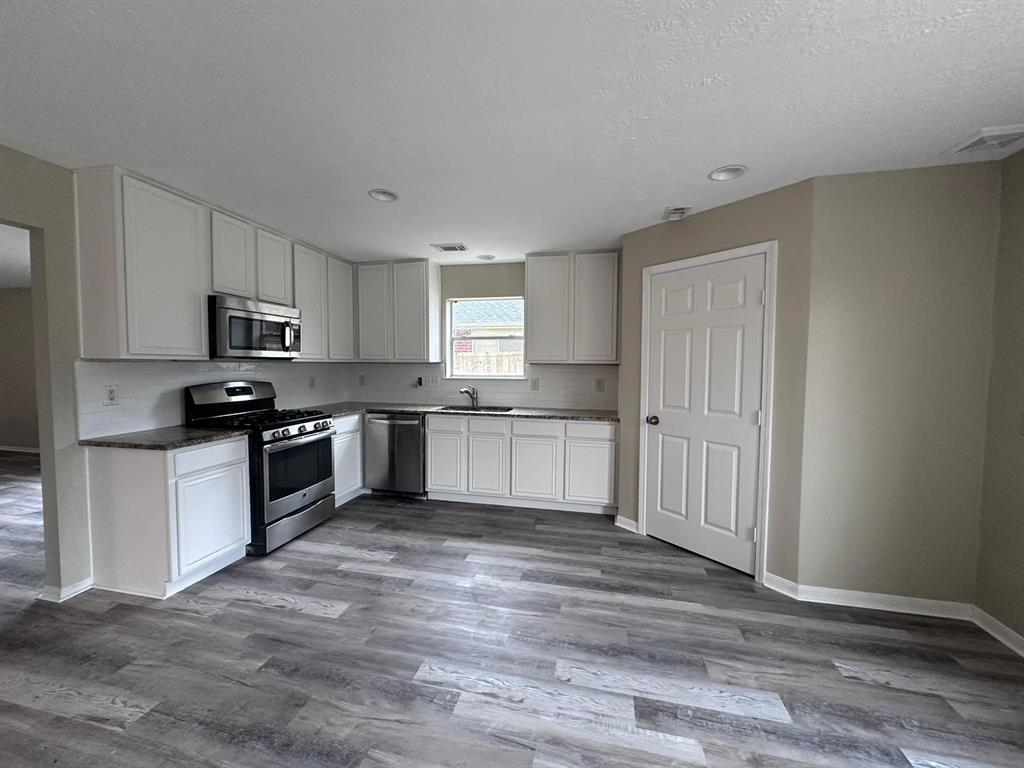
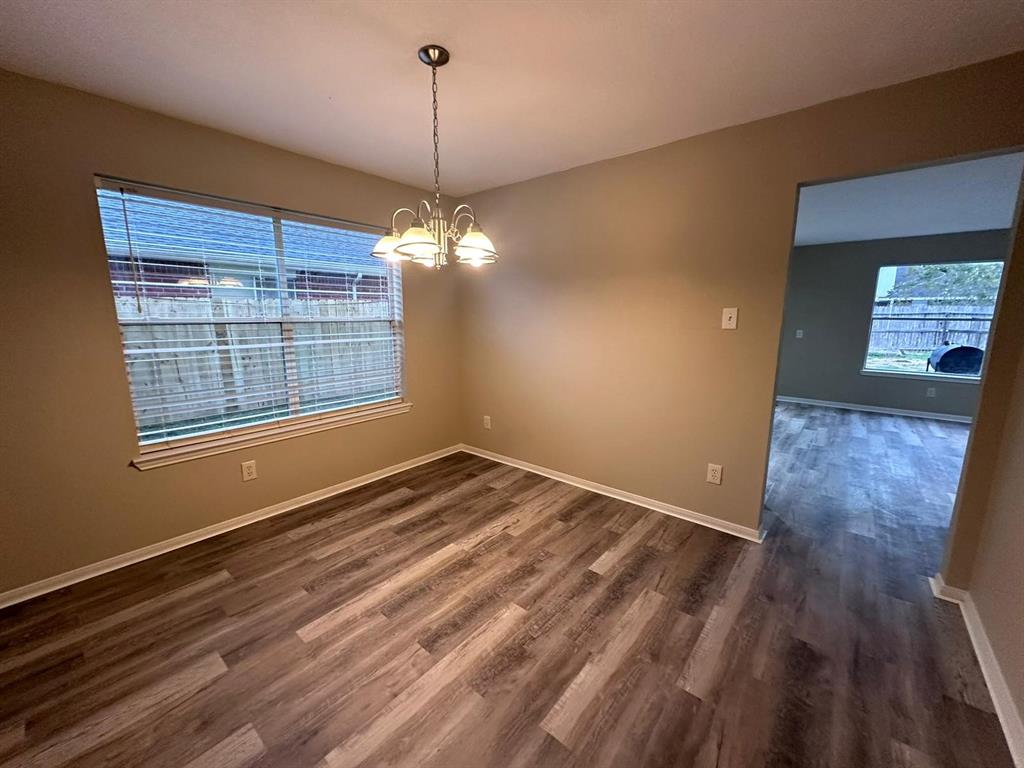
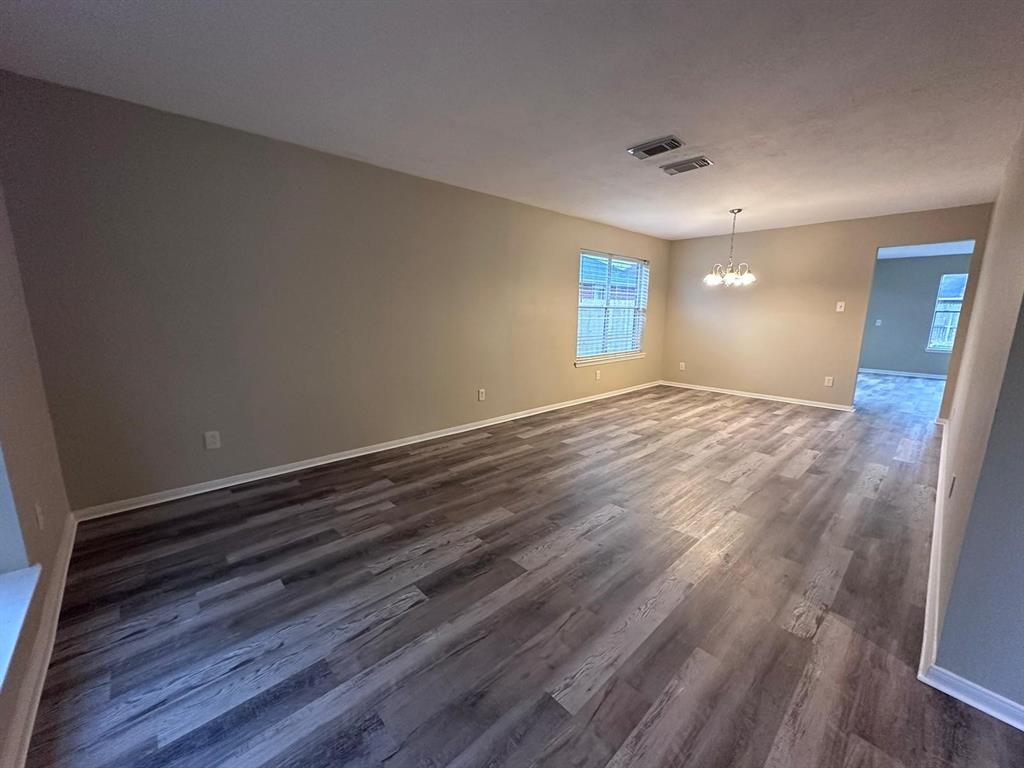
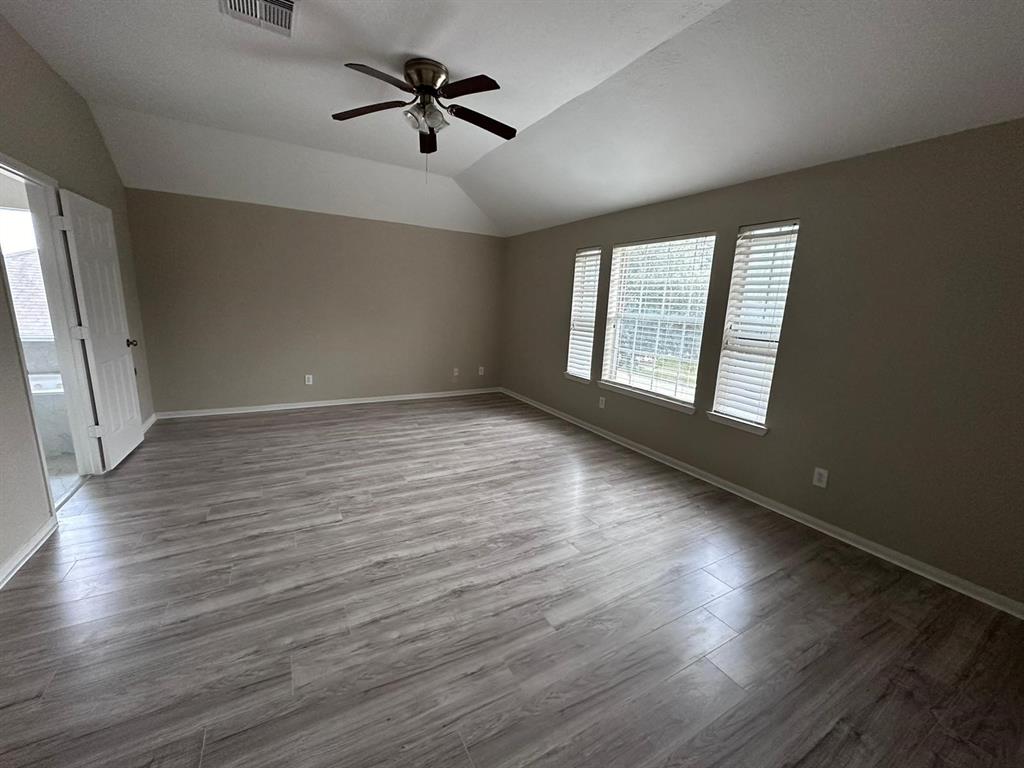
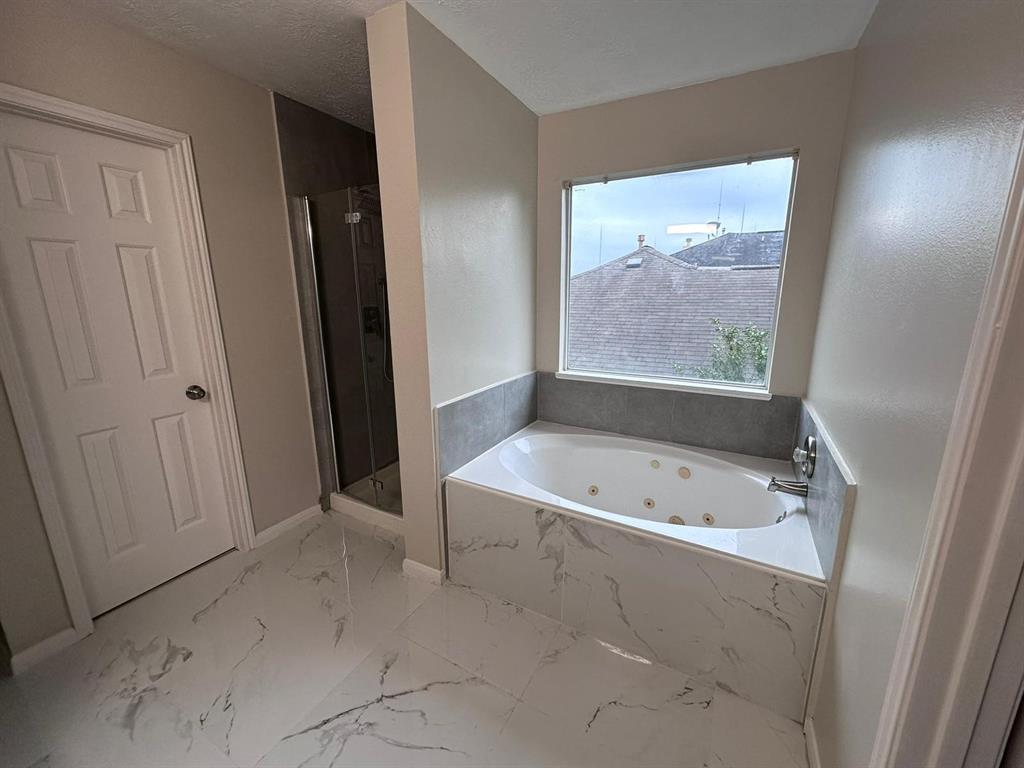
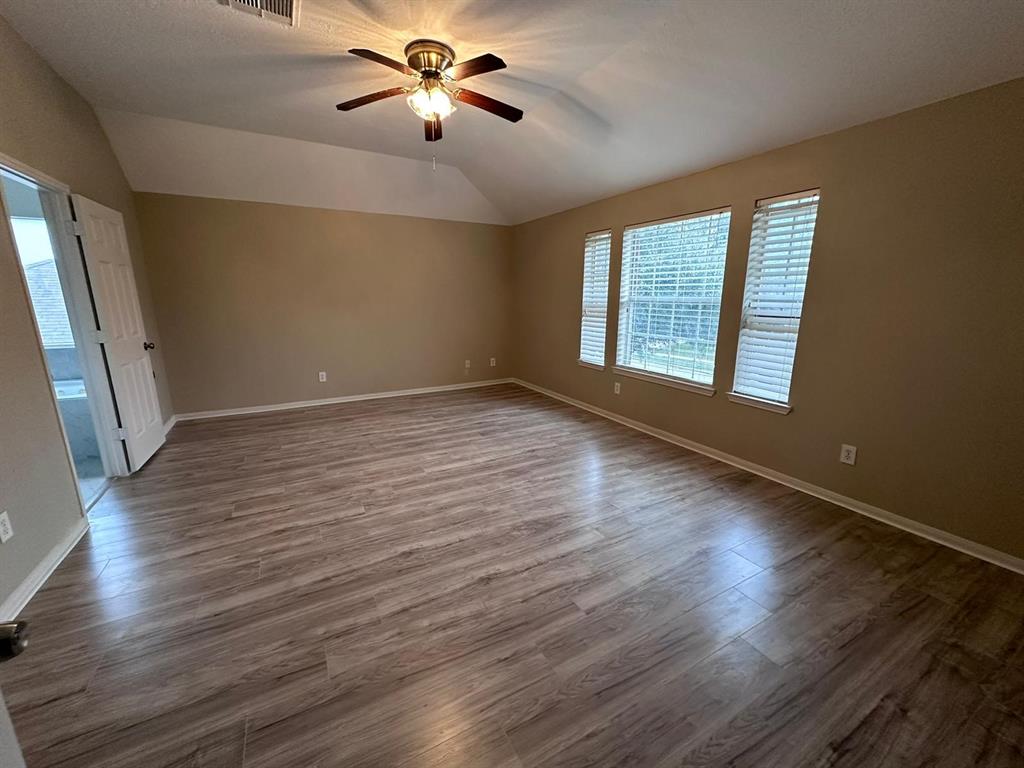
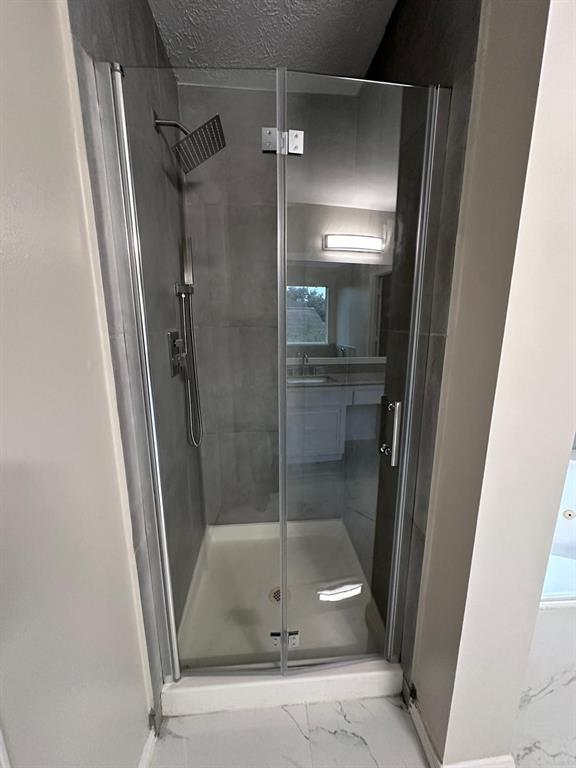
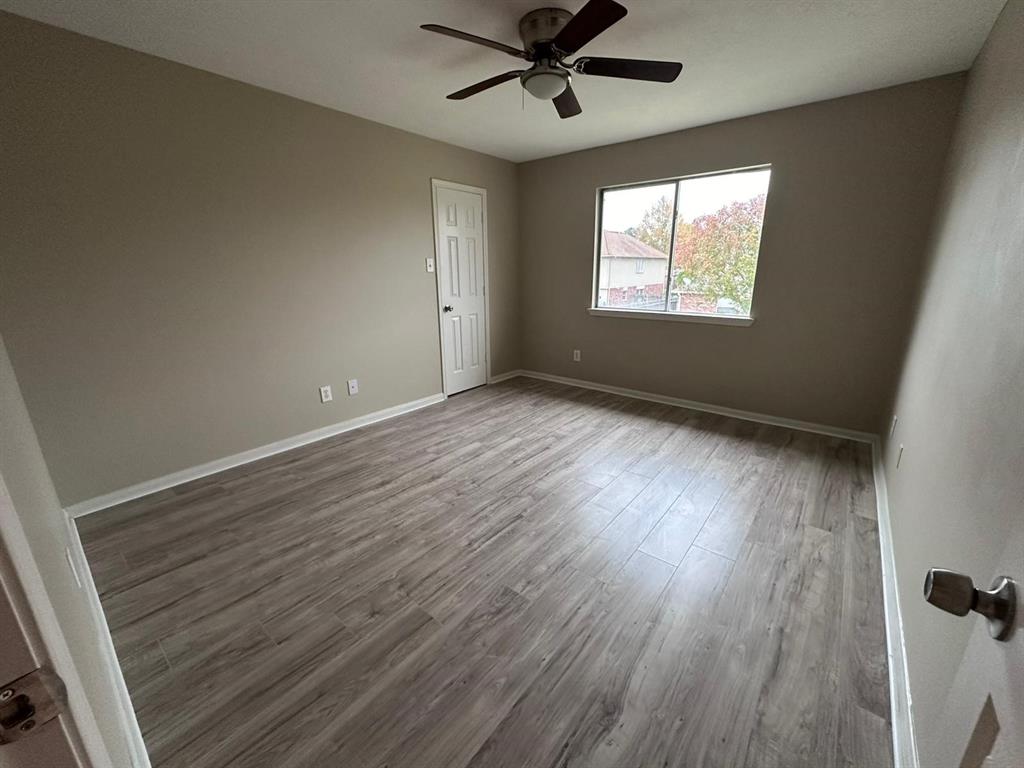
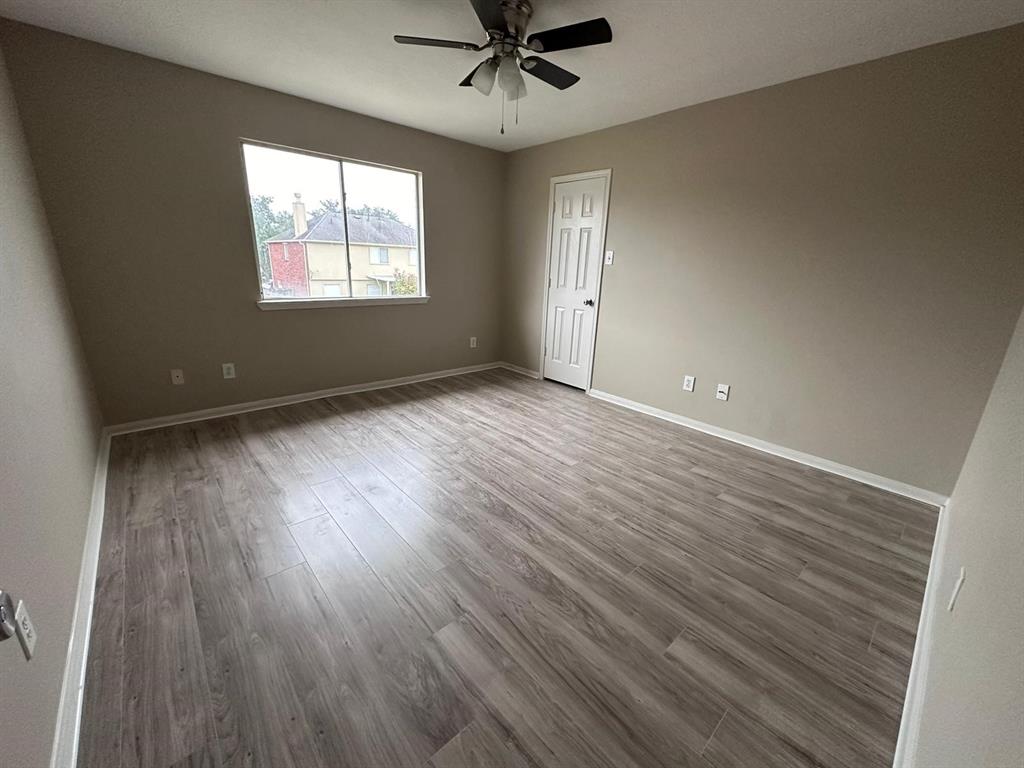
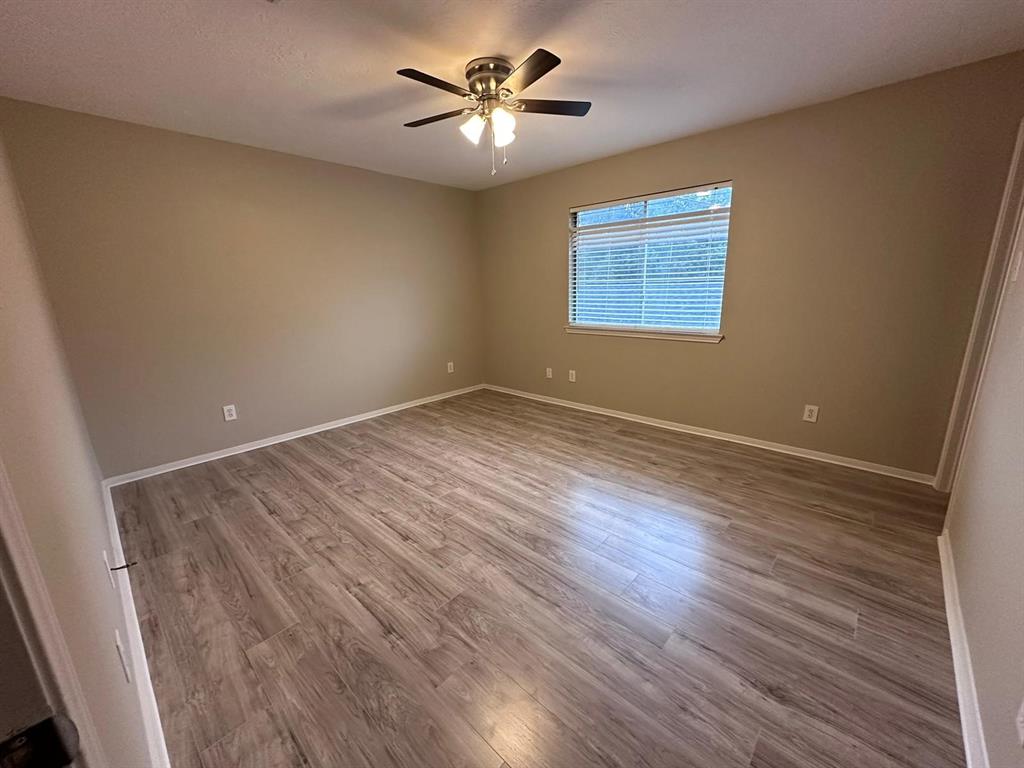
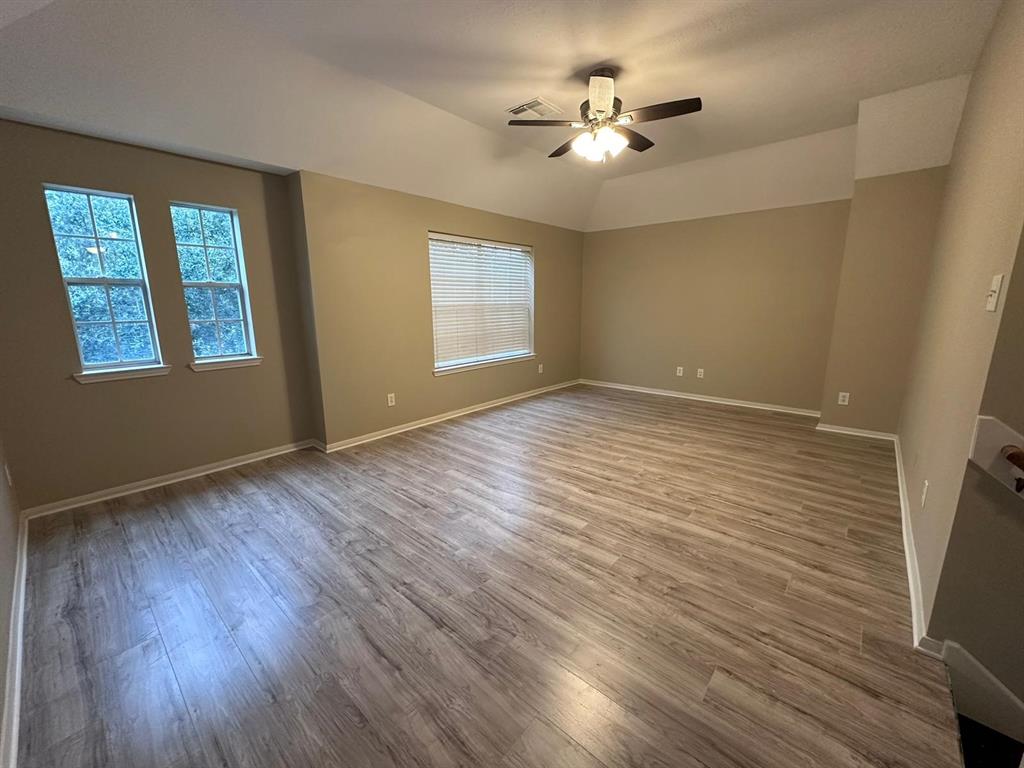
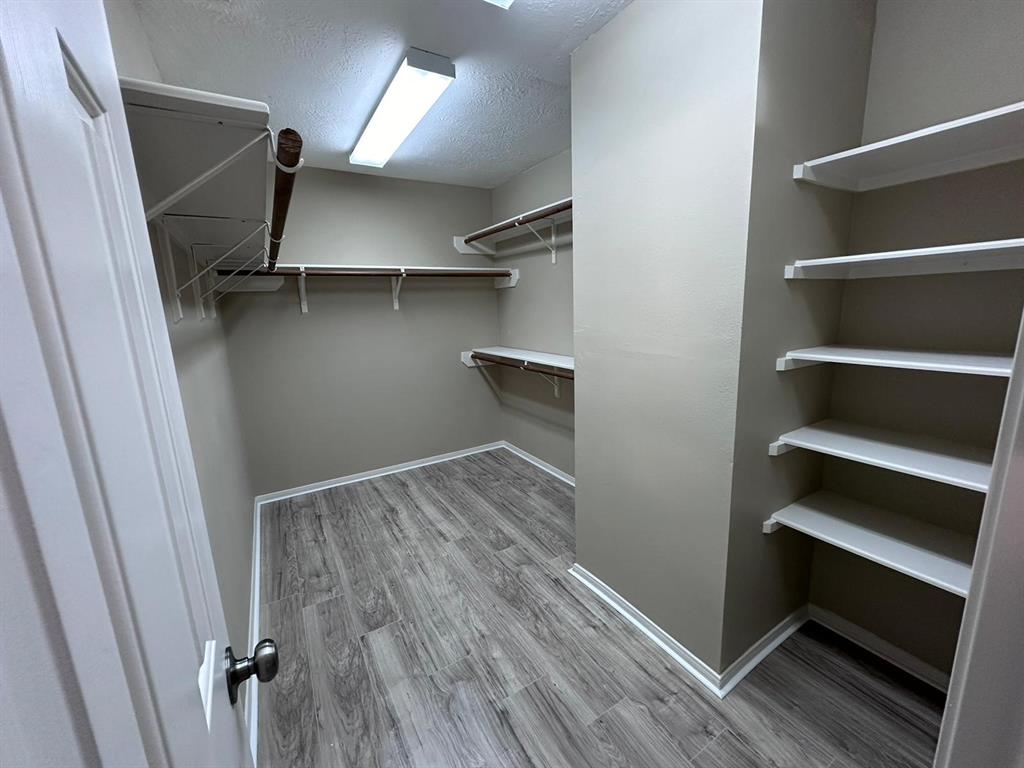
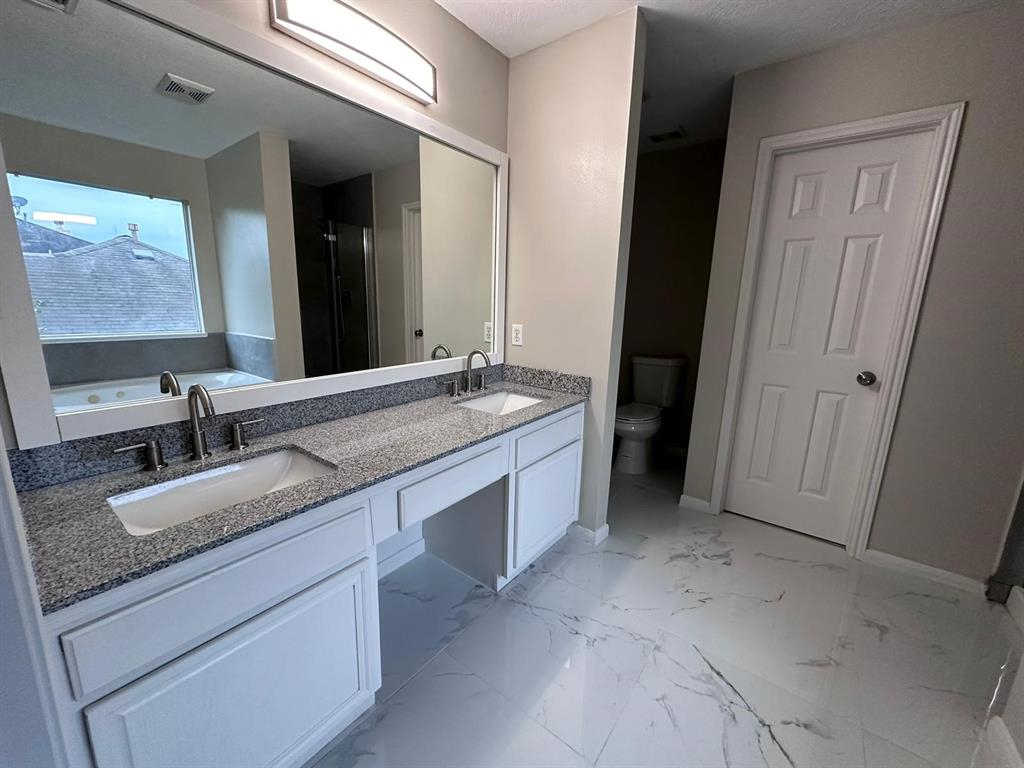
Completely remodeled spacious 4 bedroom house: New bathrooms and showers, new bathroom countertops, new Flooring first and second floor, fresh paint interior and exterior. Bonus:Game room with wet bar Huge bacckyard with lots of space to grow and a 10x8 shed included
Premium Content
Get full access to Premium Content
Sold Price for nearby listings,
Property History Reports and more.
Sign Up or
Log In Now
General Description
Sold Price Range:
$285,001 - $325,000
Address:
2119 Mountshire Dr
Legal Description:
HUNTERS GLEN SEC 5-B2, BLOCK 2, LOT 5
Property Type:
Single-Family
Baths:
2 Full & 1 Half Bath(s)
Style:
Contemporary/Modern
Year Built:
2000 / Appraisal District
Building Sqft.:
2,788 259(m²) /Appraisal District
Lot Size:
6,755 Sqft. 628(m²) /Appraisal District
Ready to sell your home?
If you are considering selling your home, you may find out how now. Request your home selling analysis featuring Recently Sold, Market Analysis, Home Valuations and Market Update.
GET STARTED
Room Dimension
Primary Bedroom:
14x12, 1st
Primary Bedroom:
14x12, 1st
Primary Bedroom:
14x12, 1st
Primary Bedroom:
19x14, 1st
Interior Features
Heating:
Central Electric
Cooling:
Central Electric
Exterior Features
Lot Description:
Subdivision Lot
Water Sewer:
Water District
Assigned School Information
School information is computer generated and may not be accurate or current. Buyer must independently verify and confirm enrollment. Please contact the school district to determine the schools to which this property is zoned.
Listing Broker: Century 21 Olympian Area Specialists
Email Listing Broker
Selling Broker: Opulence Realty, LLC
Last updated as of: 07/22/2024
Property Tax
Market Value Per Appraisal District
Cost/Sqft based on Market Value
Tax Year
Cost/sqft
Market Value
Change
Tax Assessment
Change
2023
$126.16
$351,737
18.45% $351,737
18.45%
2022
$106.51
$296,940
21.92% $296,940
21.92%
2021
$87.36
$243,550
9.00% $243,550
9.00%
2020
$80.15
$223,450
7.02% $223,450
7.02%
2019
$74.89
$208,790
1.84% $208,790
1.84%
2018
$73.54
$205,020
11.47% $205,020
11.47%
2017
$65.97
$183,920
4.09% $183,920
4.09%
2016
$63.38
$176,690
16.75% $176,690
16.75%
2015
$54.28
$151,340
18.55% $151,340
18.55%
2014
$45.79
$127,660
8.73% $127,660
8.73%
2013
$42.11
$117,410
$117,410
2023 Fort Bend County Appraisal District Tax Value
Market Land Value:
$27,600
Market Improvement Value:
$324,137
Total Market Value : $351,737
2023 Tax Rates
FORT BEND ISD:
0.9892 %
HCC MISSOURI CITY:
0.0922 %
CITY OF MISSOURI CITY:
0.5708 %
FT BEND CO GEN:
0.4265 %
FORT BEND DRNG:
0.0124 %
BLUERIDGE WEST MUD:
0.3725 %
Total Tax Rate : 2.4637 %