Sold Price Range: $185,001 - $215,000
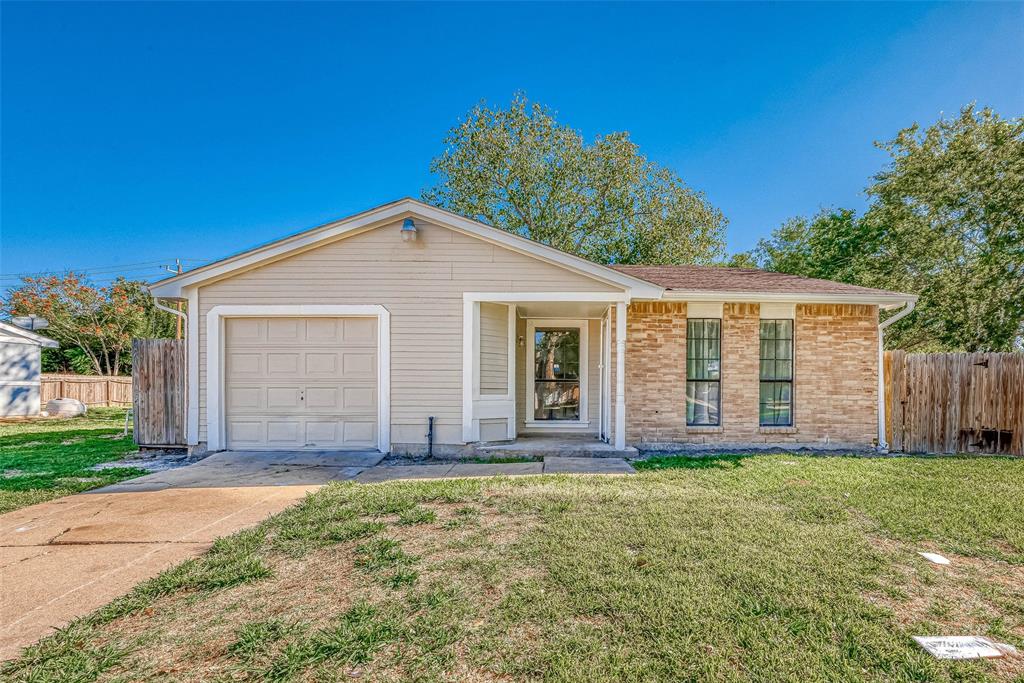
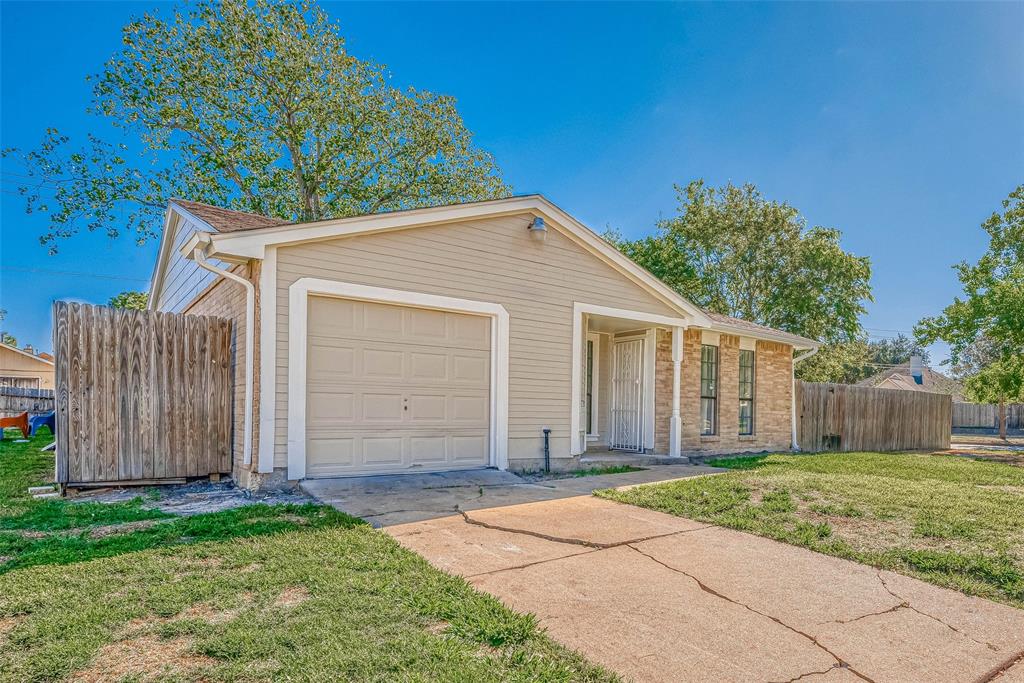
Renovated 3 BR home in Ridgegate subdivision. Open floor plan with spacious bedrooms. The home is situated on a quiet cul-de-sac. Foundation leveled (2023), new HVAC system with new ducts (2023), new electric panel and meter (2023), new granite countertops (2023), updated bathrooms, new flooring throughout, and new stainless appliances. This home is a must see!
Premium Content
Get full access to Premium Content
Sold Price for nearby listings,
Property History Reports and more.
Sign Up or
Log In Now
General Description
Sold Price Range:
$185,001 - $215,000
Address:
16231 Bowridge Ln
Legal Description:
RIDGEGATE S/D SEC 3, BLOCK 17, LOT 43
Property Type:
Single-Family
Year Built:
1981 / Appraisal District
Building Sqft.:
1,054 98(m²) /Appraisal District
Lot Size:
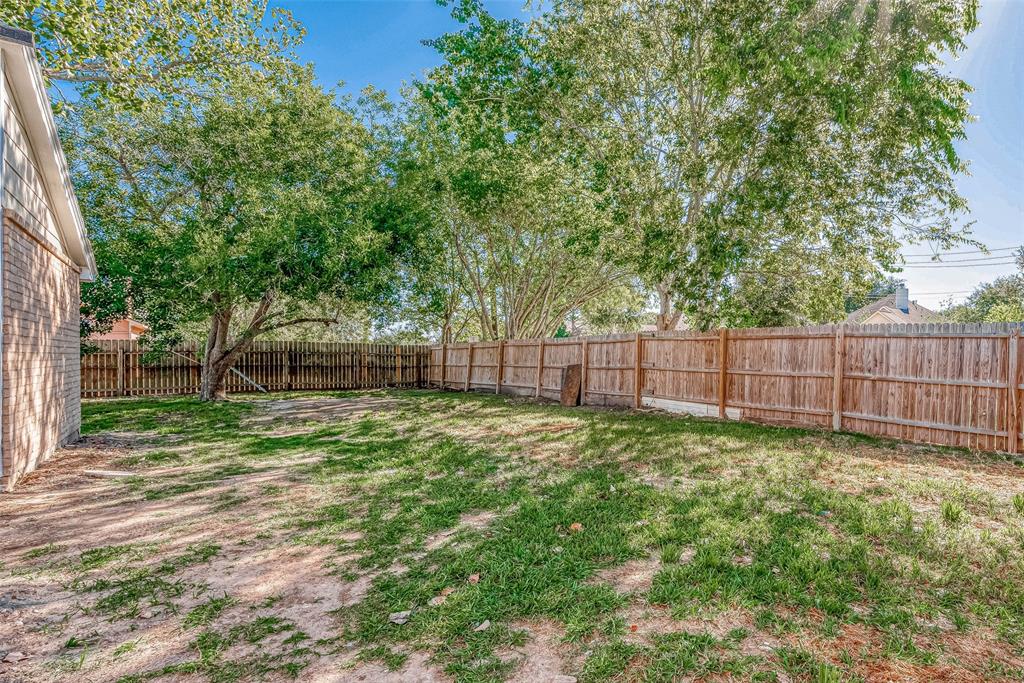
9,816 Sqft. 912(m²) /Appraisal District
Maintenance Fee:
$ 185 / Annually
Ready to sell your home?
If you are considering selling your home, you may find out how now. Request your home selling analysis featuring Recently Sold, Market Analysis, Home Valuations and Market Update.
GET STARTED
Room Dimension
Primary Bedroom:
14x12, 1st
Interior Features
Bedroom Description:
All Bedrooms Down
Bathroom Description:
Secondary Bath(s): Tub/Shower Combo, Primary Bath: Tub/Shower Combo
Room Description:
Living/Dining Combo, Utility Room in House
Cooling:
Central Electric
Heating:
Central Electric
Connections:
Electric Dryer Connections, Washer Connections
Exterior Features
Exterior Type:
Brick, Wood
Lot Description:
Cul-De-Sac
Water Sewer:
Public Sewer, Public Water
Exterior:
Back Yard Fenced
Assigned School Information
School information is computer generated and may not be accurate or current. Buyer must independently verify and confirm enrollment. Please contact the school district to determine the schools to which this property is zoned.
Listing Broker: RE/MAX Signature
Email Listing Broker
Selling Broker: Nextgen Real Estate Properties
Last updated as of: 07/22/2024
Property Tax
Market Value Per Appraisal District
Cost/Sqft based on Market Value
Tax Year
Cost/sqft
Market Value
Change
Tax Assessment
Change
2023
$145.59
$153,457
21.11% $153,457
21.11%
2022
$120.22
$126,710
11.12% $126,710
11.12%
2021
$108.19
$114,030
1.38% $114,030
1.38%
2020
$106.72
$112,480
5.95% $112,480
5.95%
2019
$100.72
$106,160
13.06% $106,160
13.06%
2018
$89.09
$93,900
18.29% $93,900
18.29%
2017
$75.31
$79,380
13.06% $79,380
13.06%
2016
$66.61
$70,210
11.85% $70,210
11.85%
2015
$59.55
$62,770
13.67% $62,770
13.67%
2014
$52.39
$55,220
-1.06% $55,220
-1.06%
2013
$52.95
$55,810
$55,810
2023 Fort Bend County Appraisal District Tax Value
Market Land Value:
$27,090
Market Improvement Value:
$126,367
Total Market Value : $153,457
2023 Tax Rates
CITY OF HOUSTON:
0.5192 %
FORT BEND ISD:
0.9892 %
FT BEND CO GEN:
0.4265 %
FORT BEND DRNG:
0.0124 %
Total Tax Rate : 1.9473 %