Sold Price Range: $250,001 - $285,000
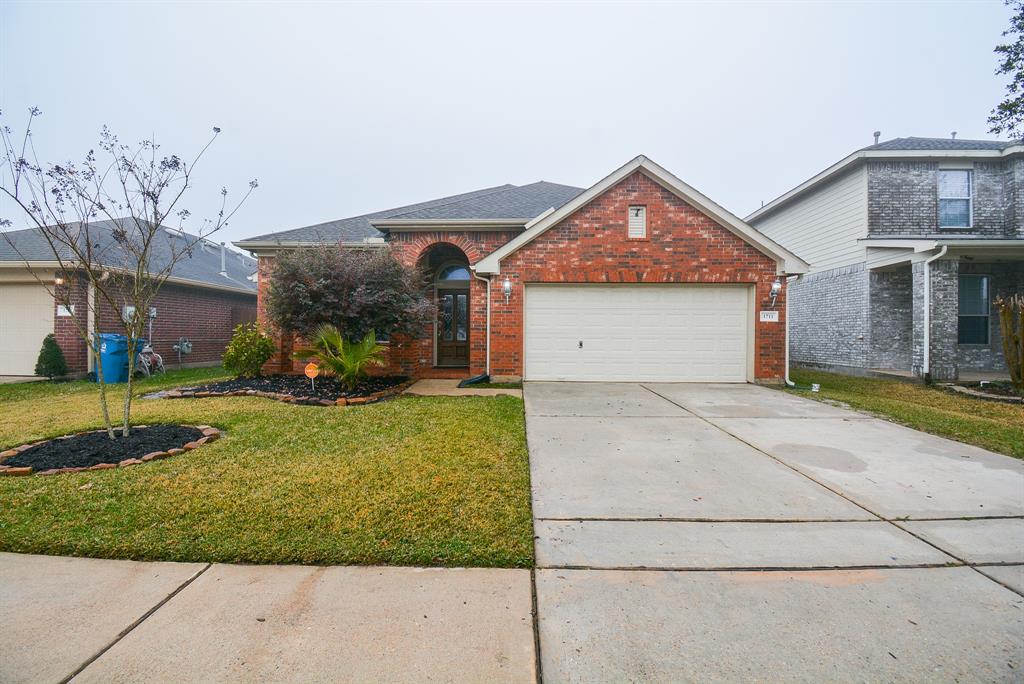
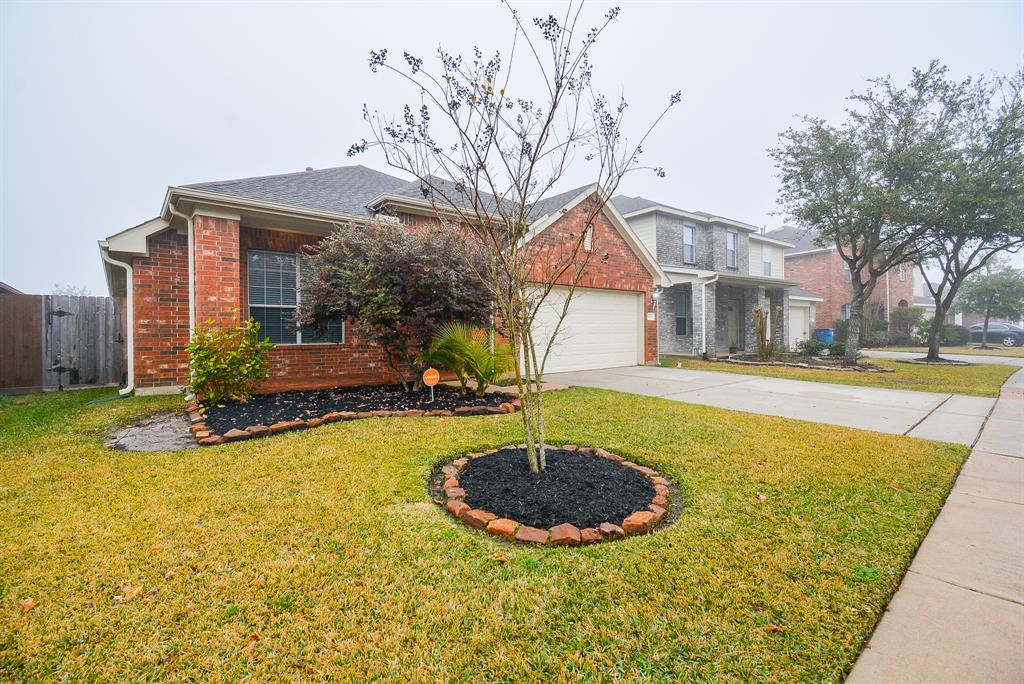
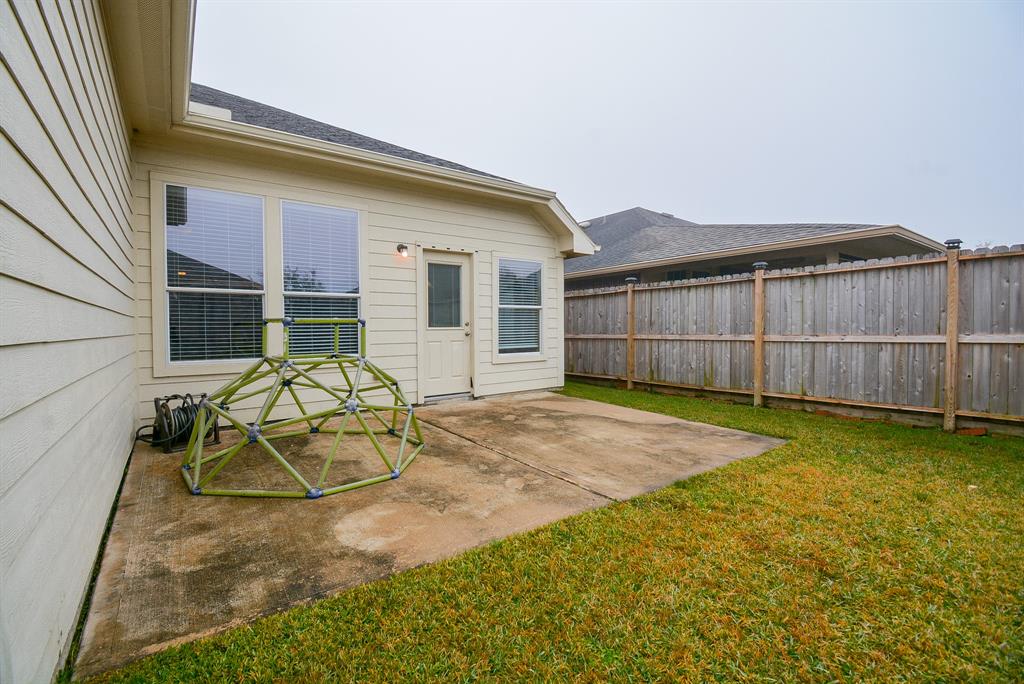
Singe story home in Sonoma Ranch. Amazing floorpan, this home has 3 bedroom and 1 office/studio, formal dining room and 2 full baths. Spacious living room area, open concept kitchen with an island. Primary bedroom separate from other rooms, 2 car garage with custom shelving. Come see it today!
Premium Content
Get full access to Premium Content
Sold Price for nearby listings,
Property History Reports and more.
Sign Up or
Log In Now
General Description
Sold Price Range:
$250,001 - $285,000
Address:
1711 Hidden Terrace Drive
Legal Description:
LT 43 BLK 4 SONOMA RANCH SEC 6
Property Type:
Single-Family
Year Built:
2007 / Appraisal District
Building Sqft.:
2,174 202(m²) /Appraisal District
Lot Size:
5,500 Sqft. 511(m²) /Appraisal District
Maintenance Fee:
$ 500 / Annually
Ready to sell your home?
If you are considering selling your home, you may find out how now. Request your home selling analysis featuring Recently Sold, Market Analysis, Home Valuations and Market Update.
GET STARTED
Room Dimension
Primary Bedroom:
13X13, 1st
Interior Features
Cooling:
Central Electric
Connections:
Washer Connections
Exterior Features
Lot Description:
Subdivision Lot
Water Sewer:
Water District
Unit Location:
Subdivision Lot
Assigned School Information
School information is computer generated and may not be accurate or current. Buyer must independently verify and confirm enrollment. Please contact the school district to determine the schools to which this property is zoned.
Listing Broker: eXp Realty, LLC
Email Listing Broker
Selling Broker: Opendoor Brokerage, LLC
Last updated as of: 06/30/2024
Property Tax
Market Value Per Appraisal District
Cost/Sqft based on Market Value
Tax Year
Cost/sqft
Market Value
Change
Tax Assessment
Change
2023
$125.57
$273,000
11.20% $273,000
13.52%
2022
$112.93
$245,500
11.14% $240,491
10.00%
2021
$101.60
$220,884
11.13% $218,629
10.00%
2020
$91.42
$198,754
5.62% $198,754
5.62%
2019
$86.56
$188,178
13.36% $188,178
13.36%
2018
$76.36
$166,000
0.00% $166,000
0.00%
2017
$76.36
$166,000
2.91% $166,000
2.91%
2016
$74.20
$161,310
2.07% $161,310
2.07%
2015
$72.69
$158,032
0.00% $158,032
8.64%
2014
$72.69
$158,032
19.51% $145,460
10.00%
2013
$60.83
$132,237
10.00% $132,237
10.00%
2012
$55.30
$120,216
$120,216
2023 Harris County Appraisal District Tax Value
Market Land Value:
$43,043
Market Improvement Value:
$229,957
Total Market Value : $273,000
2023 Tax Rates
CHANNELVIEW ISD:
0.9921 %
HARRIS COUNTY:
0.3501 %
HC FLOOD CONTROL DIST:
0.0311 %
PORT OF HOUSTON AUTHORITY:
0.0057 %
HC HOSPITAL DIST:
0.1434 %
HC DEPARTMENT OF EDUCATION:
0.0048 %
SAN JACINTO COM COL D:
0.1462 %
HC MUD 53:
0.3000 %
HC EMERG SRV DIST 50:
0.0470 %
Total Tax Rate : 2.0204 %