Sold Price Range: $160,001 - $185,000
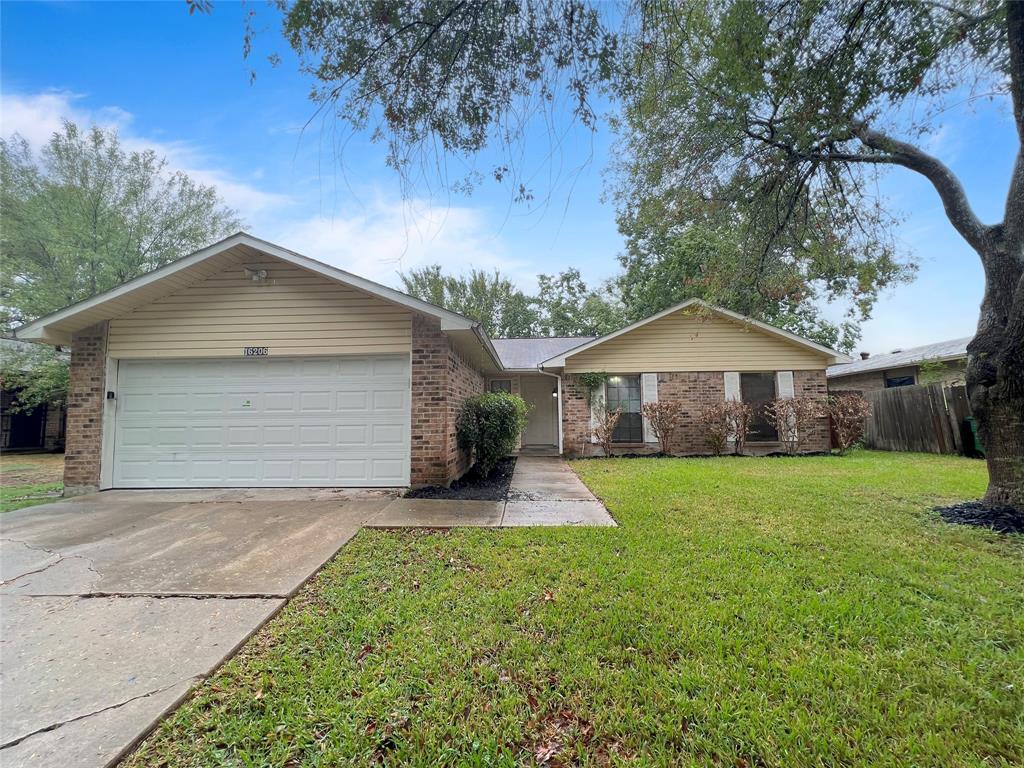
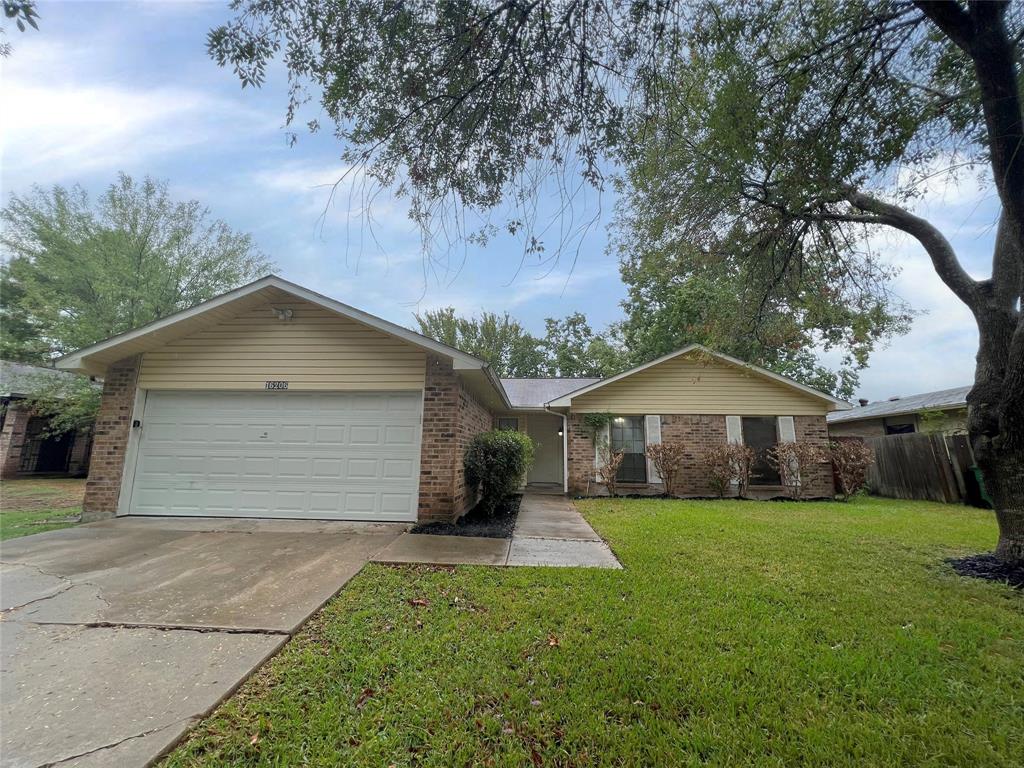
Welcome to this 3 bedroom, 2 bath home located in the Ridgegate subdivision. This home features an open floor plan with a spacious kitchen, living area with a wood burning fireplace, a formal dining room, and a huge backyard that's great for entertaining your family and friends. Book a tour with your agent today and feel right at home!
Premium Content
Get full access to Premium Content
Sold Price for nearby listings,
Property History Reports and more.
Sign Up or
Log In Now
General Description
Sold Price Range:
$160,001 - $185,000
Address:
16206 Knollridge Ct
Legal Description:
RIDGEGATE S/D SEC 3, BLOCK 15, LOT 35
Property Type:
Single-Family
Year Built:
1980 / Appraisal District
Building Sqft.:
1,803 167(m²) /Appraisal District
Lot Size:
7,426 Sqft. 690(m²) /Appraisal District
Maintenance Fee:
$ 240 / Annually
Ready to sell your home?
If you are considering selling your home, you may find out how now. Request your home selling analysis featuring Recently Sold, Market Analysis, Home Valuations and Market Update.
GET STARTED
Room Dimension
Primary Bedroom:
17x12, 1st
Interior Features
Cooling:
Central Electric
Heating:
Central Electric
Exterior Features
Lot Description:
Subdivision Lot
Water Sewer:
Public Sewer, Public Water
Assigned School Information
School information is computer generated and may not be accurate or current. Buyer must independently verify and confirm enrollment. Please contact the school district to determine the schools to which this property is zoned.
Listing Broker: Entera Realty LLC
Email Listing Broker
Selling Broker: Keller Williams Premier Realty
Last updated as of: 07/22/2024
Property Tax
Market Value Per Appraisal District
Cost/Sqft based on Market Value
Tax Year
Cost/sqft
Market Value
Change
Tax Assessment
Change
2023
$124.24
$224,007
26.73% $224,007
26.73%
2022
$98.04
$176,760
16.42% $176,760
16.42%
2021
$84.21
$151,830
-0.03% $151,830
-0.03%
2020
$84.24
$151,880
6.77% $151,880
6.77%
2019
$78.90
$142,250
6.45% $142,250
6.45%
2018
$74.12
$133,630
20.17% $133,630
20.17%
2017
$61.67
$111,200
17.37% $111,200
17.37%
2016
$52.55
$94,740
18.63% $94,740
18.63%
2015
$44.29
$79,860
8.67% $79,860
8.67%
2014
$40.76
$73,490
-1.24% $73,490
-1.24%
2013
$41.27
$74,410
$74,410
2023 Fort Bend County Appraisal District Tax Value
Market Land Value:
$27,090
Market Improvement Value:
$196,917
Total Market Value : $224,007
2023 Tax Rates
CITY OF HOUSTON:
0.5192 %
FORT BEND ISD:
0.9892 %
FT BEND CO GEN:
0.4265 %
FORT BEND DRNG:
0.0124 %
Total Tax Rate : 1.9473 %