Sold Price Range: $627,001 - $717,000
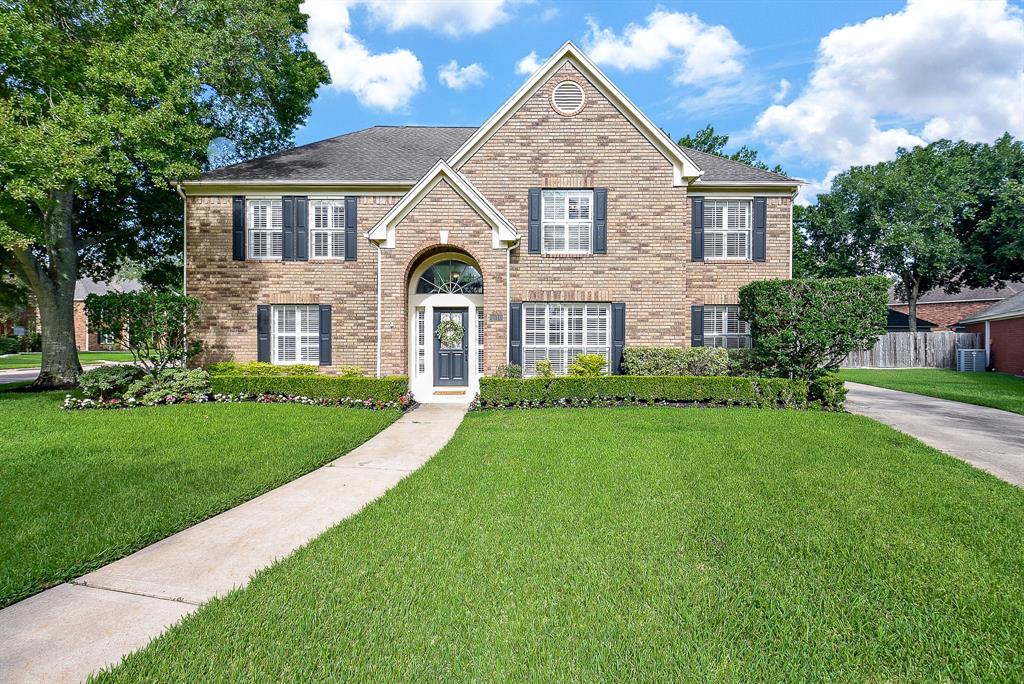
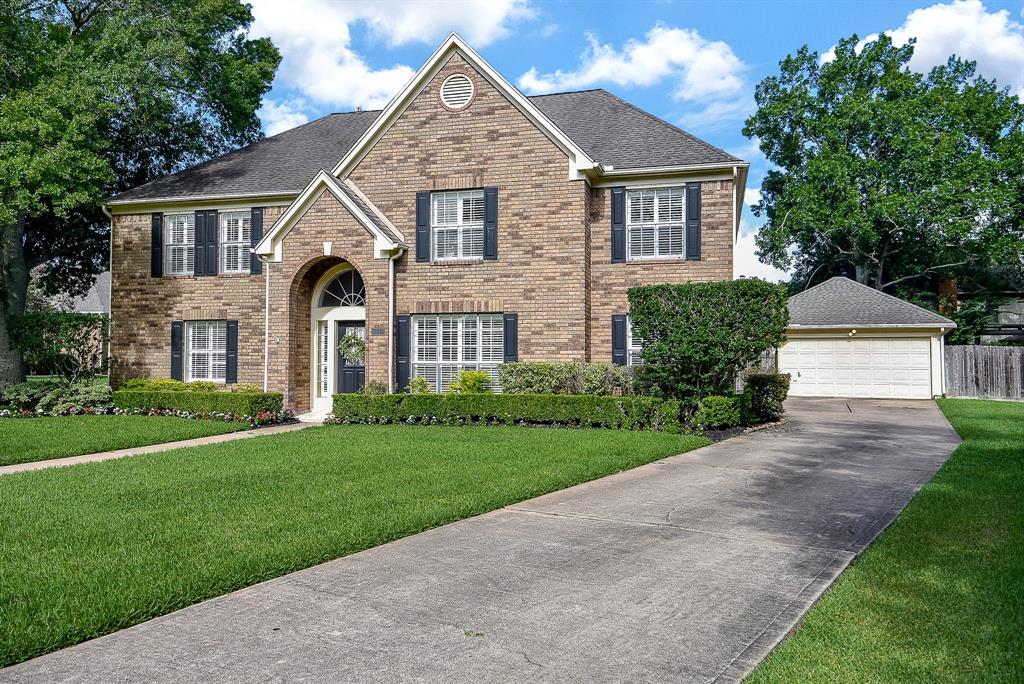
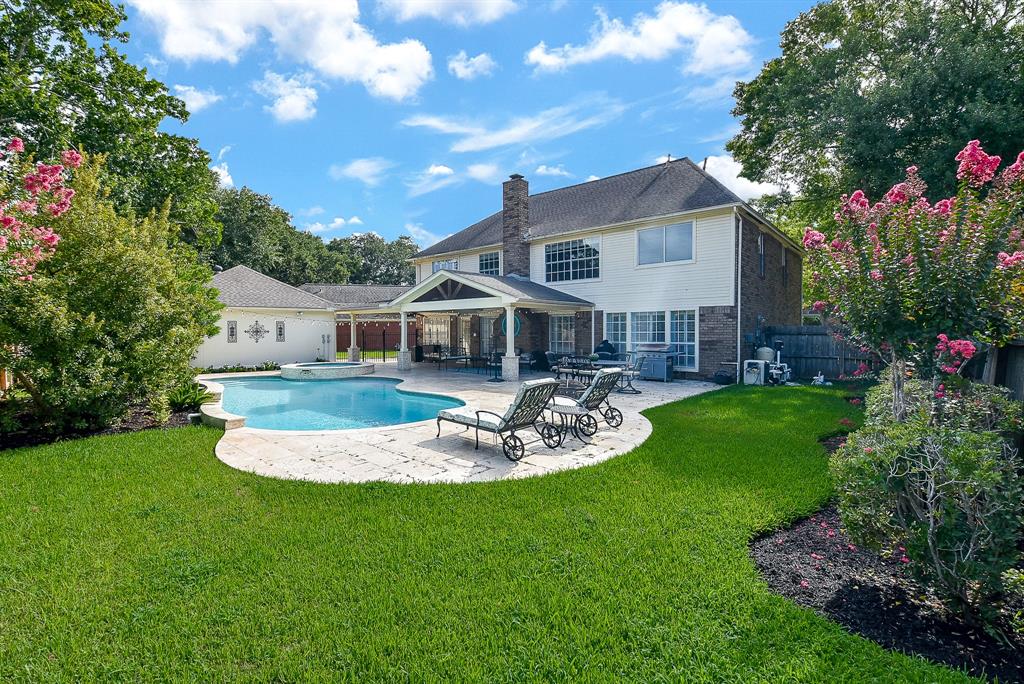
This beautiful home has modern colors and tasteful updates! Zoned to top rated schools! Located on a large corner lot of a cul-de-sac street. The tropical backyard features covered patio overlooking the pool and hot tub for year-round fun and entertainment. CUSTOM FEATURES include built-in bookshelves in game room and office, crown molding, plantation shutters, french doors to study, granite in kitchen and bathrooms and gorgeous wood floors.
Premium Content
Get full access to Premium Content
Sold Price for nearby listings,
Property History Reports and more.
Sign Up or
Log In Now
General Description
Sold Price Range:
$627,001 - $717,000
Address:
4410 Chipping Ct
Legal Description:
OXFORD SEC 1, BLOCK 2, LOT 12
Property Type:
Single-Family
Baths:
2 Full & 1 Half Bath(s)
Year Built:
1988 / Appraisal District
Building Sqft.:
3,252 302(m²) /Appraisal District
Lot Size:
10,345 Sqft. 961(m²) /Appraisal District
Maintenance Fee:
$ 965 / Annually
Ready to sell your home?
If you are considering selling your home, you may find out how now. Request your home selling analysis featuring Recently Sold, Market Analysis, Home Valuations and Market Update.
GET STARTED
Room Dimension
Family Room:
23 x 17, 1st
Primary Bedroom:
16 x 14, 1st
Home Office/Study:
12 x 12, 2nd
Interior Features
Fireplace:
1/Gas Connections
Floors:
Carpet, Tile, Wood
Bedroom Description:
Primary Bed - 1st Floor
Room Description:
Breakfast Room, Family Room, Formal Dining, Gameroom Up, Home Office/Study
Cooling:
Central Electric
Energy Feature:
Ceiling Fans, Attic Vents
Exterior Features
Private Pool Desc:
Gunite, In Ground
Exterior Type:
Brick, Wood
Lot Description:
Corner, Cul-De-Sac, Subdivision Lot
Water Sewer:
Public Sewer, Public Water
Assigned School Information
School information is computer generated and may not be accurate or current. Buyer must independently verify and confirm enrollment. Please contact the school district to determine the schools to which this property is zoned.
Listing Broker: Benevides & Associates
Email Listing Broker
Selling Broker: Realm Real Estate Professionals - Katy
Last updated as of: 07/16/2024
Property Tax
Market Value Per Appraisal District
Cost/Sqft based on Market Value
Tax Year
Cost/sqft
Market Value
Change
Tax Assessment
Change
2023
$176.76
$574,827
17.21% $459,701
10.00%
2022
$150.81
$490,420
29.09% $417,910
10.00%
2021
$116.83
$379,920
-0.89% $379,920
-0.89%
2020
$117.88
$383,330
0.28% $383,330
0.28%
2019
$117.54
$382,250
-5.91% $382,250
-5.91%
2018
$124.93
$406,270
-1.81% $406,270
-1.81%
2017
$127.24
$413,780
-0.63% $413,780
1.71%
2016
$128.05
$416,410
12.59% $406,840
10.00%
2015
$113.73
$369,850
9.96% $369,850
9.96%
2014
$103.43
$336,340
3.56% $336,340
3.56%
2013
$99.87
$324,770
$324,770
2023 Fort Bend County Appraisal District Tax Value
Market Land Value:
$63,800
Market Improvement Value:
$511,027
Total Market Value : $574,827
2023 Tax Rates
FORT BEND ISD:
0.9892 %
FT BEND CO GEN:
0.4265 %
FORT BEND DRNG:
0.0124 %
CITY OF SUGAR LAND:
0.3500 %
FIRST COL LID 2:
0.1700 %
Total Tax Rate : 1.9481 %