Sold Price Range: $370,001 - $420,000
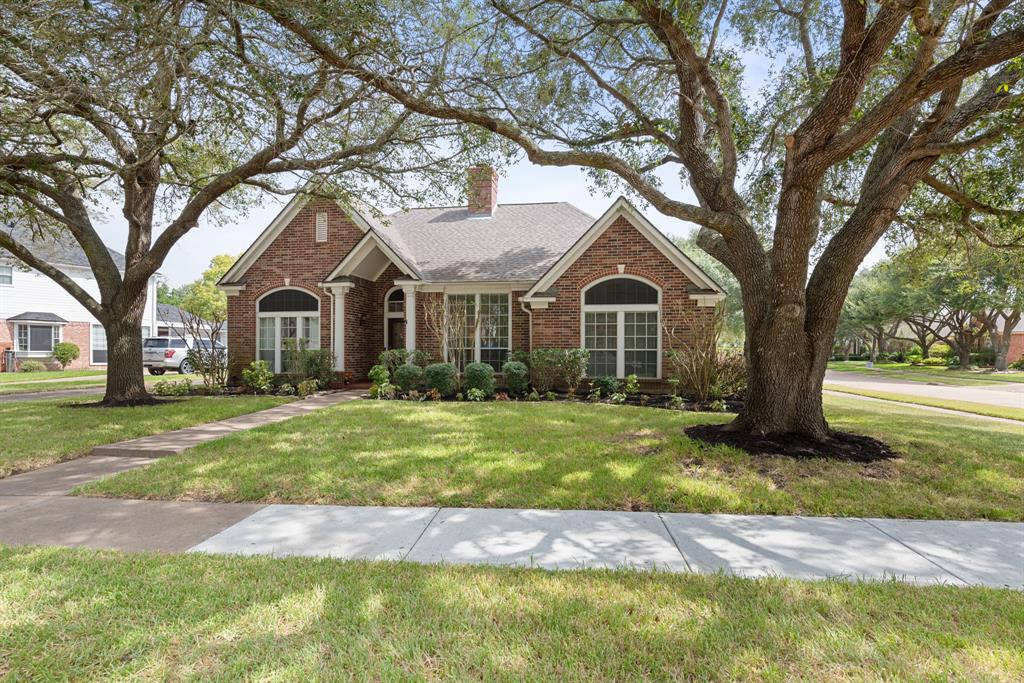
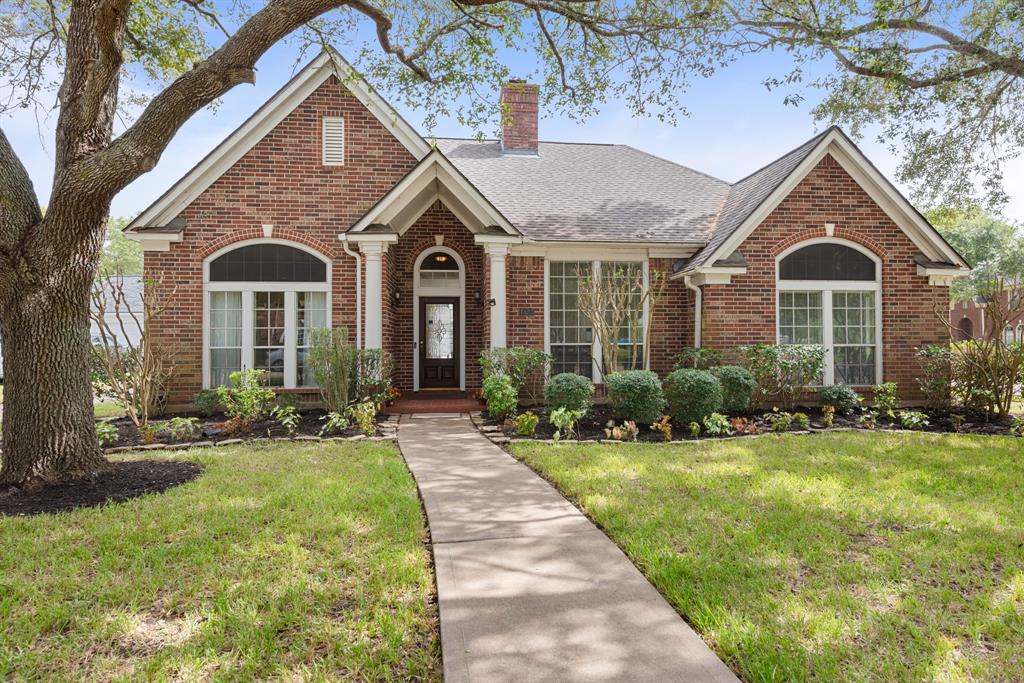
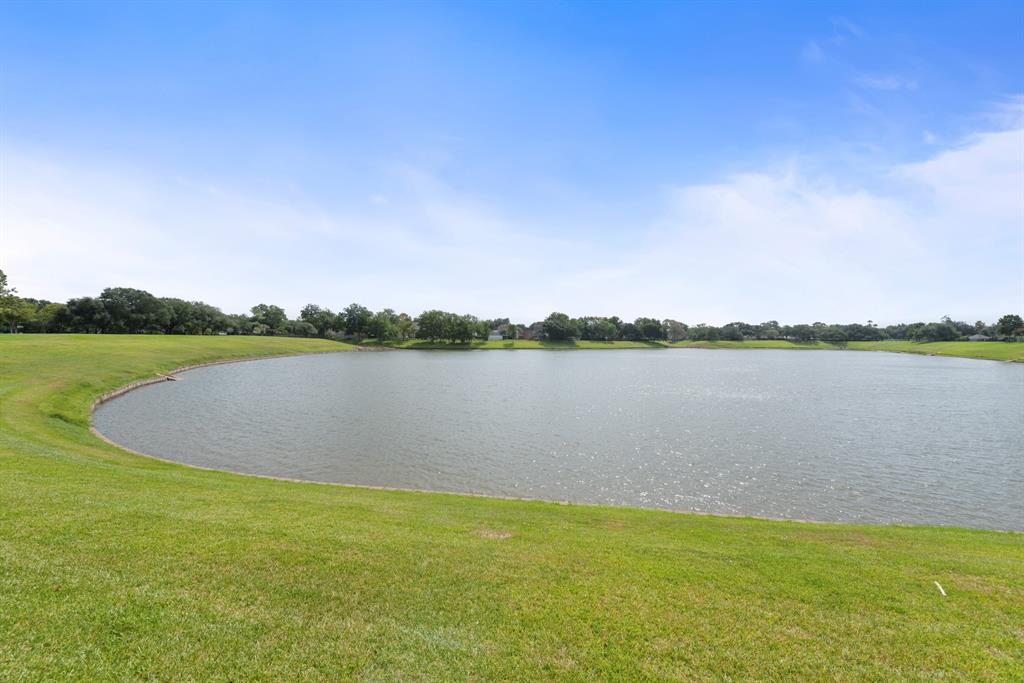
Lake view corner lot, crown molding, chair rail, ceiling fans, stylish granite counters, tiled back splash, tiled and carpet flooring, marbled entry, electric cook top, double sinks, separate tub and shower, wood burning fire place, stained leaded glass front door, slate back patio, walking distance to recreational facility and Commonwealth Elementary School.
Premium Content
Get full access to Premium Content
Sold Price for nearby listings,
Property History Reports and more.
Sign Up or
Log In Now
General Description
Sold Price Range:
$370,001 - $420,000
Address:
4523 Devonshire Street
Legal Description:
BRIDGEWATER SEC 2, BLOCK 2, LOT 6
Property Type:
Single-Family
Garage(s):
2 / Attached/Detached
Year Built:
1993 / Appraisal District
Building Sqft.:
2,491 231(m²) /Appraisal District
Lot Size:
9,466 Sqft. 879(m²) /Appraisal District
Maintenance Fee:
$ 945 / Annually
Ready to sell your home?
If you are considering selling your home, you may find out how now. Request your home selling analysis featuring Recently Sold, Market Analysis, Home Valuations and Market Update.
GET STARTED
Room Dimension
Primary Bedroom:
16x14, 1st
Interior Features
Fireplace:
1/Wood Burning Fireplace
Bedroom Description:
All Bedrooms Down
Kitchen Description:
Breakfast Bar, Pantry
Bathroom Description:
Double Sinks
Room Description:
1 Living Area, Formal Dining, Formal Living, Study/Library
Cooling:
Central Electric
Energy Feature:
Ceiling Fans
Exterior Features
Lot Description:
Subdivision Lot
Water Sewer:
Public Sewer, Public Water
Unit Location:
Subdivision Lot
Exterior:
Back Yard, Back Yard Fenced, Patio/Deck
Assigned School Information
School information is computer generated and may not be accurate or current. Buyer must independently verify and confirm enrollment. Please contact the school district to determine the schools to which this property is zoned.
Listing Broker: Champion Real Estate
Email Listing Broker
Selling Broker: Midland Realty Group
Last updated as of: 07/17/2024
Property Tax
Market Value Per Appraisal District
Cost/Sqft based on Market Value
Tax Year
Cost/sqft
Market Value
Change
Tax Assessment
Change
2023
$167.54
$417,330
-0.34% $417,330
-0.34%
2022
$168.10
$418,740
14.28% $418,740
14.28%
2021
$147.09
$366,410
-0.65% $366,410
-0.65%
2020
$148.05
$368,800
3.43% $368,800
3.43%
2019
$143.14
$356,560
-1.85% $356,560
-1.85%
2018
$145.84
$363,290
2.53% $363,290
2.53%
2017
$142.25
$354,340
-3.85% $354,340
-3.85%
2016
$147.94
$368,530
1.88% $368,530
1.88%
2015
$145.21
$361,720
15.65% $361,720
15.65%
2014
$125.56
$312,780
8.99% $312,780
8.99%
2013
$115.20
$286,970
$286,970
2023 Fort Bend County Appraisal District Tax Value
Market Land Value:
$78,540
Market Improvement Value:
$338,790
Total Market Value : $417,330
2023 Tax Rates
FORT BEND ISD:
0.9892 %
FT BEND CO GEN:
0.4265 %
FORT BEND DRNG:
0.0124 %
CITY OF SUGAR LAND:
0.3500 %
FIRST COL LID 2:
0.1700 %
Total Tax Rate : 1.9481 %