Pearland home price trends DECEMBER 2023
Ladies and gentlemen, today we will delve into the fascinating world of real estate metrics. For both buyers and sellers, understanding these metrics is key to making informed decisions in the market. So, let's dive in and explore the correlations between some important real estate metrics.
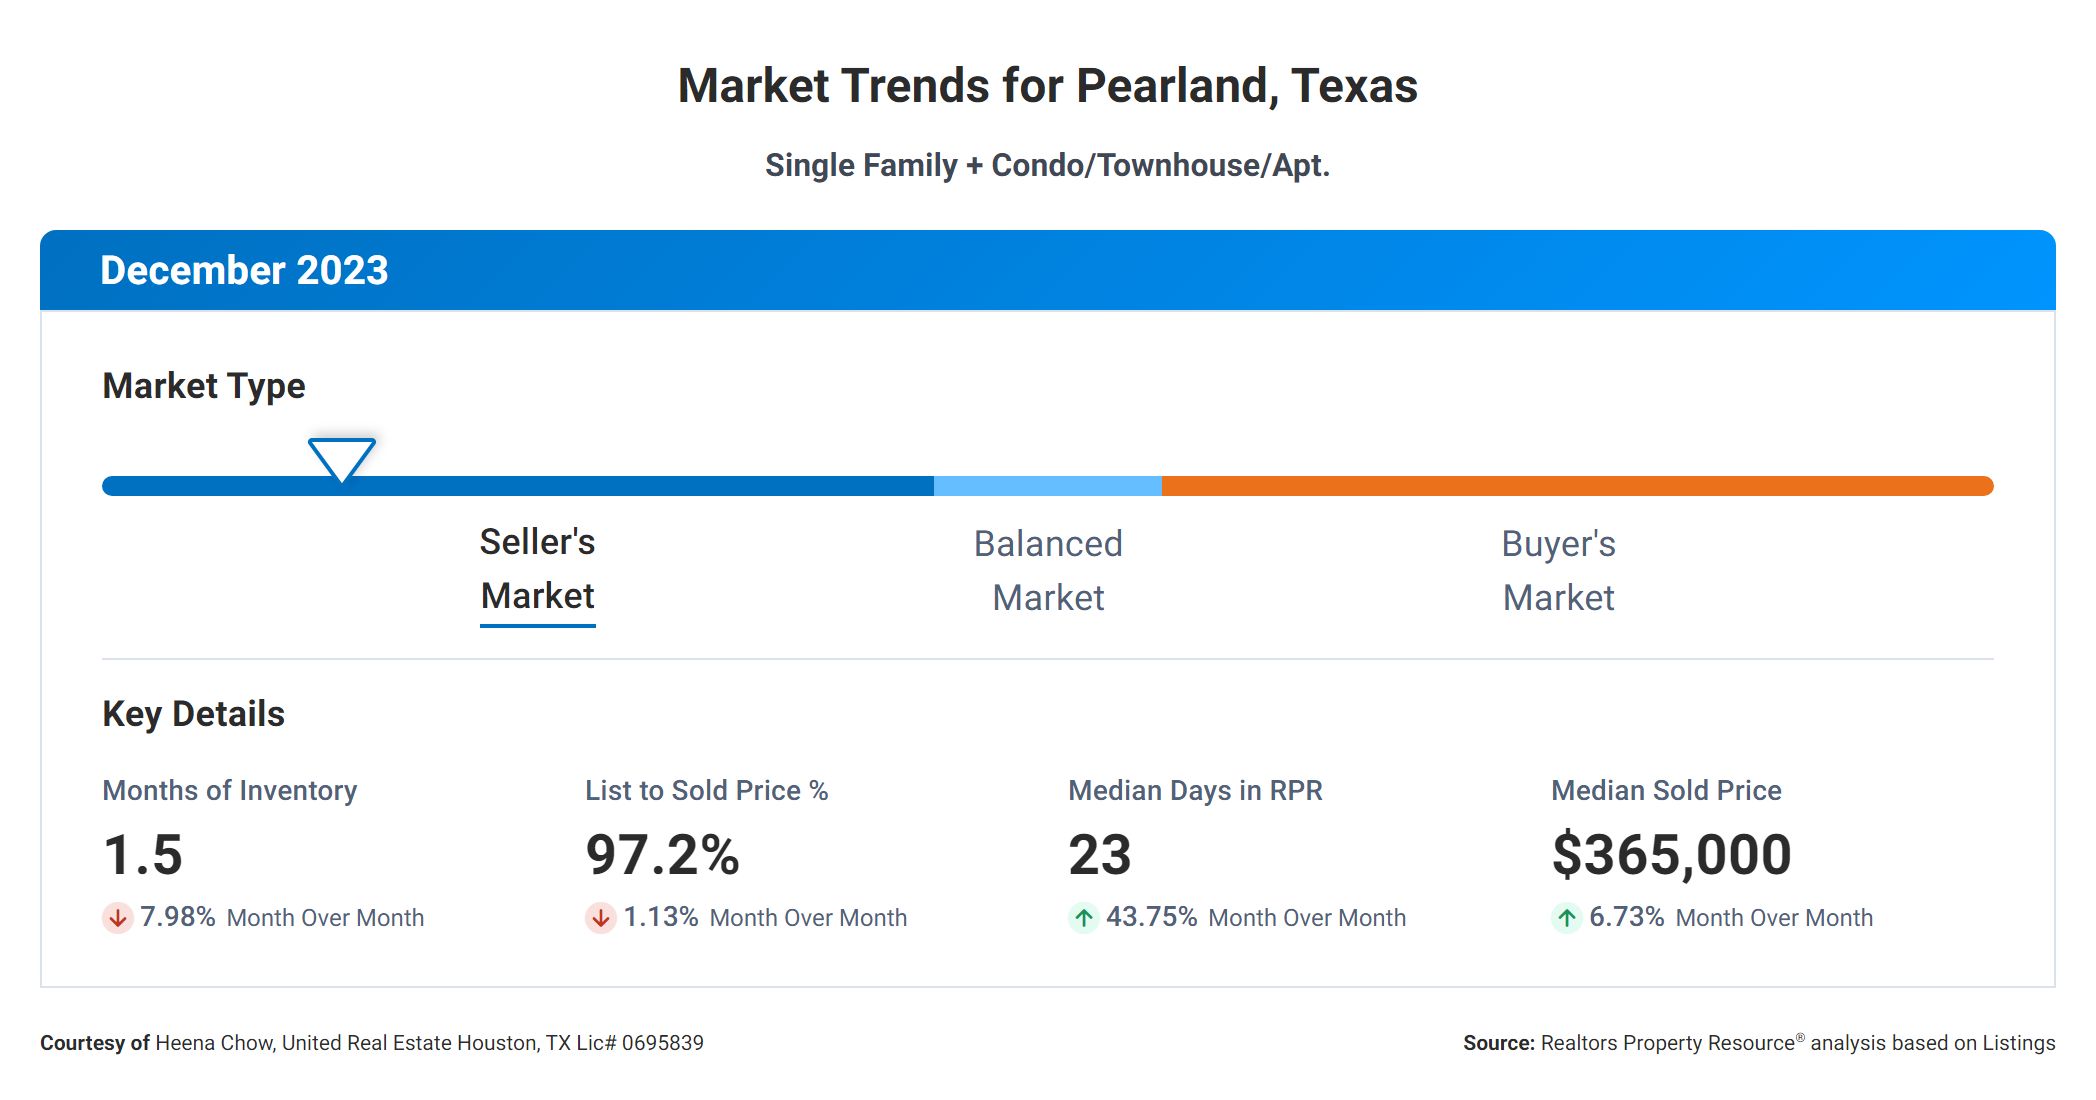
First, let's take a look at the "Months Supply of Inventory," which currently stands at 1.5. This metric represents the number of months it would take to sell all the homes on the market if no new listings were added. A lower number indicates a seller's market, where demand exceeds supply. In this case, with a relatively low 1.5 months supply, we can infer that there is a high demand for homes in this market.
Now, let's shift our focus to the "12-Month Change in Months of Inventory," which has seen a positive increase of 1.35%. This metric measures the percentage change in the number of months it would take to sell all the homes on the market compared to the previous year. A positive change indicates a decrease in supply relative to demand. Therefore, this increase suggests that the supply of homes has decreased slightly over the past year.
Moving on, we come to the "Median Days Homes are On the Market," which currently stands at 23 days. This metric represents the average number of days it takes for a home to sell once it is listed. With a relatively low median days on the market, we can infer that homes are selling quickly in this market. This might be indicative of high demand or well-priced properties.
Next, let's explore the "List to Sold Price Percentage," which is at an impressive 97.2%. This metric represents the percentage of the listing price that a home ultimately sells for. A higher percentage indicates that homes are selling very close to their asking prices. In this case, with a list to sold price percentage of 97.2%, we can conclude that sellers are achieving a high percentage of their asking prices, which is great news for them.
Finally, let's take a look at the "Median Sold Price," which currently stands at $365,000. This metric represents the middle point of all the sold prices in the market. With a median sold price of $365,000, we can infer that this market is in a certain price range. Buyers and sellers alike can use this information to understand the average price point for properties in this area.
In conclusion, these real estate metrics provide valuable insights into the current market conditions. The low "Months Supply of Inventory" and high "List to Sold Price Percentage" suggest a strong seller's market with high demand and homes selling close to their asking prices. The "Median Days Homes are On the Market" indicates that homes are selling quickly, while the "Median Sold Price" gives us an idea of the average price range in this market.
For buyers, it's important to be prepared for a competitive market and act quickly when finding a property of interest. For sellers, it's a favorable market with high demand and the potential to achieve a good sale price.
Remember, understanding these real estate metrics empowers you to make informed decisions in the market. Whether you're buying or selling, being knowledgeable about the current market conditions will help you navigate the real estate landscape with confidence.
