2020 has changed home supply for 2021. Find out what that means for potential home buyers!
The housing market typically follows fairly reliable seasonal trends, but 2020 won’t be known for following predictable patterns.
Every year, colder weather and the holidays accompany a shift downward in home prices as well as the number of homes for sale. In the fourth quarter of 2020, several local markets saw slightly lower list prices from the previous quarter, but with no supply to spare, the annual dip in listings left first-time buyers with even fewer options in the largest metro areas and nationwide.
In NerdWallet’s analysis of home affordability for first-time buyers in the fourth quarter of 2020, homes remained unaffordable across most of the 50 largest metropolitan areas, despite list prices falling just slightly compared with the previous quarter. And with just a single exception — San Francisco — homes became even more difficult to find when compared with one year prior. Together, these factors no doubt made it difficult for first-time buyers to take advantage of low mortgage rates, as they typically have tighter budgets than repeat buyers.
Still, first-time buyers accounted for about 31% of sales in the fourth quarter, according to the National Association of Realtors, proving some are battling the market headwinds, and winning.
A very slight seasonal fourth quarter price dip led to increased affordability in some metro areas. Homes were listed at 5 times first-time buyer income, on average, among the 50 largest metro areas, compared with 5.2 times their income in the third quarter.
A price point three times your annual income is considered a good starting point when gauging how much house you can afford. For first-time buyers, this guidance often has to be stretched. When sellers can command full list price (or more), as they can in the current market, buyers with lower annual earnings may be especially hard-pressed to find homes that fit neatly in their monthly balance sheet.
Still, because prices dipped in a few markets, homes became slightly more affordable for some shoppers in the fourth quarter. In four metro areas, homes were listed at 3.2 times median first-time buyer income — St. Louis, Pittsburgh, Cleveland and Buffalo, New York — making them the most affordable in this analysis, and all more affordable than they were in the third quarter.
The least affordable metro areas for first-timers remained the same from last quarter: Los Angeles, where homes were listed at 12 times median first-time buyer income; San Diego (8.6); San Jose, California (7.7); San Francisco (7.2); and Sacramento, California (6.9).
Nationwide, homes were listed for 4.7 times median first-time buyer income in the fourth quarter.
Click here for a table containing affordability data for all 50 metros analyzed.
First-time buyer guidance: Winter is generally the least expensive time to buy a home (with a few exceptions). While starter homes don’t magically go from out of reach to attainable this time of year, especially in 2020-2021, the cold weather and holiday season may mean less competition, and more motivated sellers. If buyers have any increased leverage, now would be the time. To be sure, supply is constrained during these months, too, even more so in 2020-2021, so pickings will be slimmer. But if pricing is your top concern, the end of the fourth quarter leading into the first may be your best bet for your budget.
Generally, high demand and limited supply send prices upward. And we saw that happen throughout 2020. But many metro areas still saw a slight, seasonal dip in the fourth quarter.
Of the 50 metros analyzed, 37 saw list prices either remain the same or decrease quarter over quarter. Four metros saw prices fall 10% or more from the third quarter: Buffalo, New York (-10%); Louisville, Kentucky (-12%); Cleveland (-13%); and Milwaukee (-15%).
Across the nation, list prices fell just 1% from the third to the fourth quarter, and 2%, on average, across the largest metro areas.
However, even with this slight seasonal relief, prices were still up over the fourth quarter of 2019, nearly across the board. Prices remained the same or dipped less than 1% in just five metros, year over year.
First-time buyer guidance: List prices are generally a starting point for negotiations, but in a seller’s market, homes often fetch the asking price or more. When shopping for a home in 2021, first-timers should be aware that their ability to negotiate is limited. Not only are they more likely to pay the sticker price they see on their favorite home listing app, but they’ll also have less power to negotiate contingencies, like the cost of any needed repairs. To boost your chances of actually closing on the house you want, be willing to make some sacrifices.
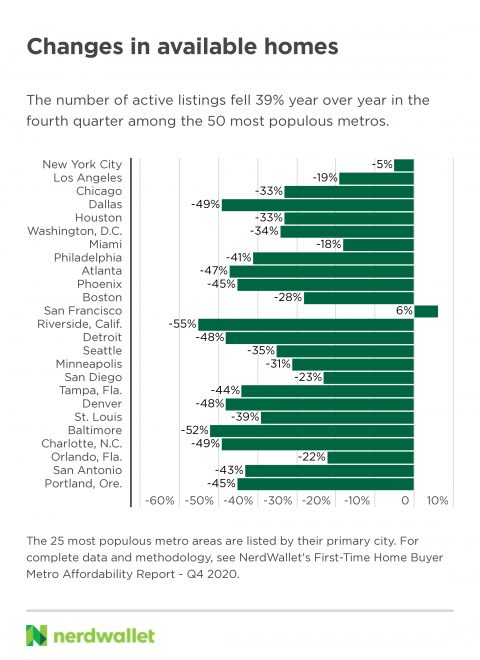
Inventory is expected to tighten in the winter, beginning in the fourth quarter, but in 2020, it didn’t have too far to fall. Inventory was frighteningly low throughout 2020, but fell further, down 12% from the third quarter among the most populous metros, on average, and down 13% nationally. Among both areas, the number of active listings was down 39% year over year.
Six metro areas experienced year-over-year inventory decreases of more than 50% in the fourth quarter: Riverside, California (-55%); Salt Lake City (-53%); Providence, Rhode Island (-52%); Baltimore (-52%); Austin, Texas (-52%); and Memphis, Tennessee (-51%).
First-time buyer guidance: With the supply of homes down nearly everywhere buyers look, the only way to deepen the pool of potential homes is to expand the search parameters. Being flexible with your target neighborhood or city, home features and what makes it to your must-have list will improve your odds in this tight market. Flexibility on closing or move-in dates can give you an edge, too. Renters may pay a penalty for this adaptability, by breaking a lease, but it could be worth the cost to become homeowners. And for buyers who just can’t budge, being content to rent until the market or their budget changes may be less stressful.
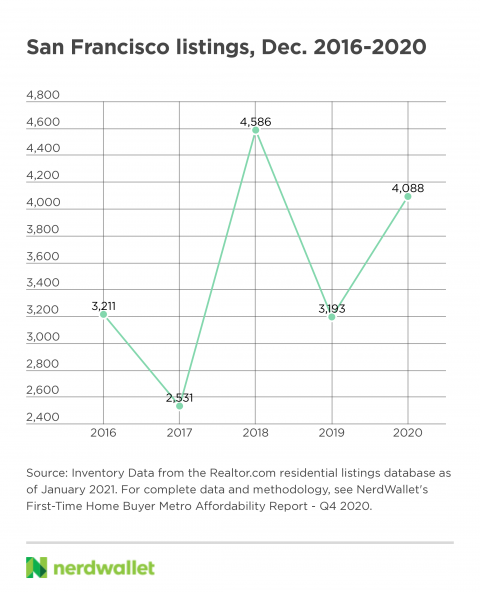
Seeing San Francisco — traditionally one of the most competitive markets in the country — as the only metro where inventory increased in the fourth quarter is surprising, at first blush. However, the 6% year-over-year gain doesn’t tell the entire story.
Upon closer look, San Francisco’s increase can be explained by a single month, December. Compared with December 2019, listings were up 28% in 2020, a healthy increase that affected the quarterly average (listings were down 4% in October and up a more modest 5% in November, the other two months of the quarter).
So what happened in December? A look back over the past several years reveals the number of homes on the market in December has been volatile in this particular metro area. For instance, in December 2018, active listings were up a whopping 81% from the year before, to about 4,600. In December 2019, they were down 30% comparatively, to around 3,200. So while the 28% year-over-year climb in December 2020 seems a remarkable jump in isolation, the number of listings that month (roughly 4,100) is comfortably in between the previous two Decembers.
All this to say: Inventory is constrained in San Francisco, too. Given the high demand in that market, and that homes there are listed at 7.2 times first-time buyer income, new shoppers in San Francisco have their work cut out for them.
Subscribe to our monthly newsletter for up-to-date real estate industry trends, news, and insights.

