Sold Price Range: $250,001 - $285,000
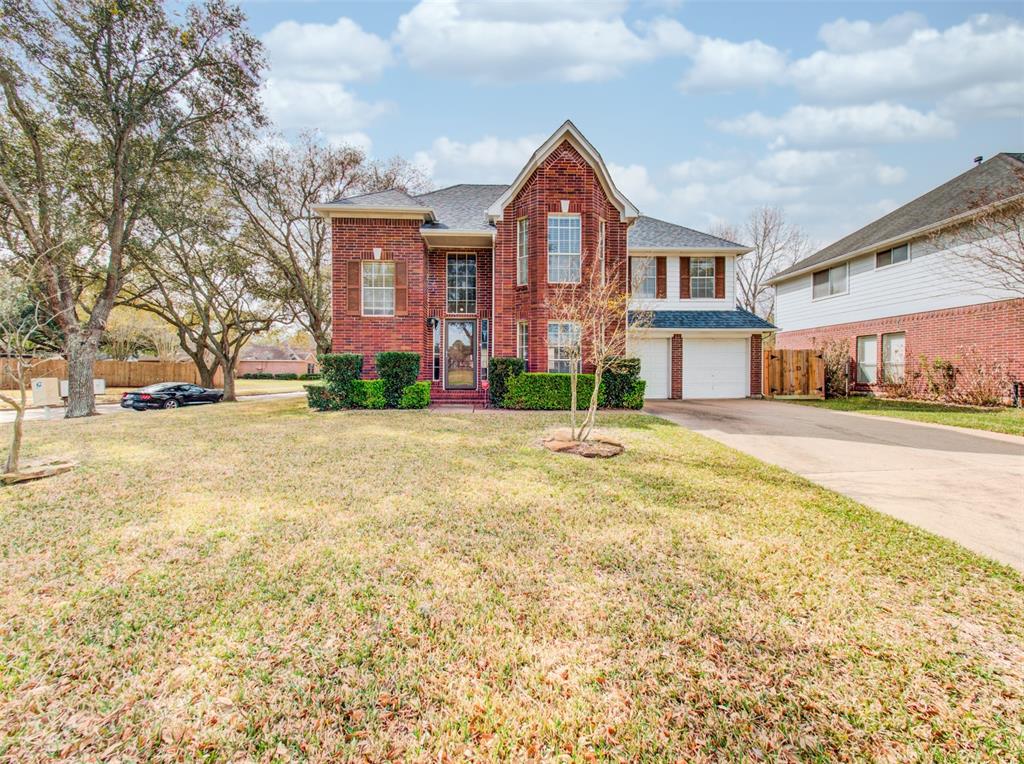
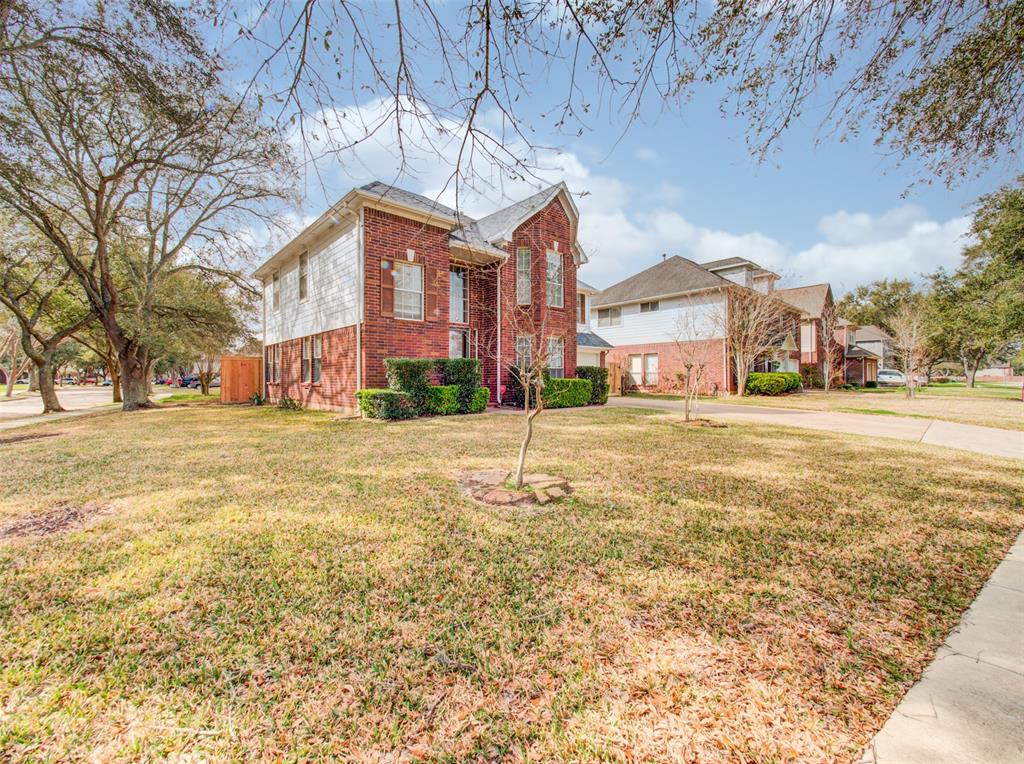
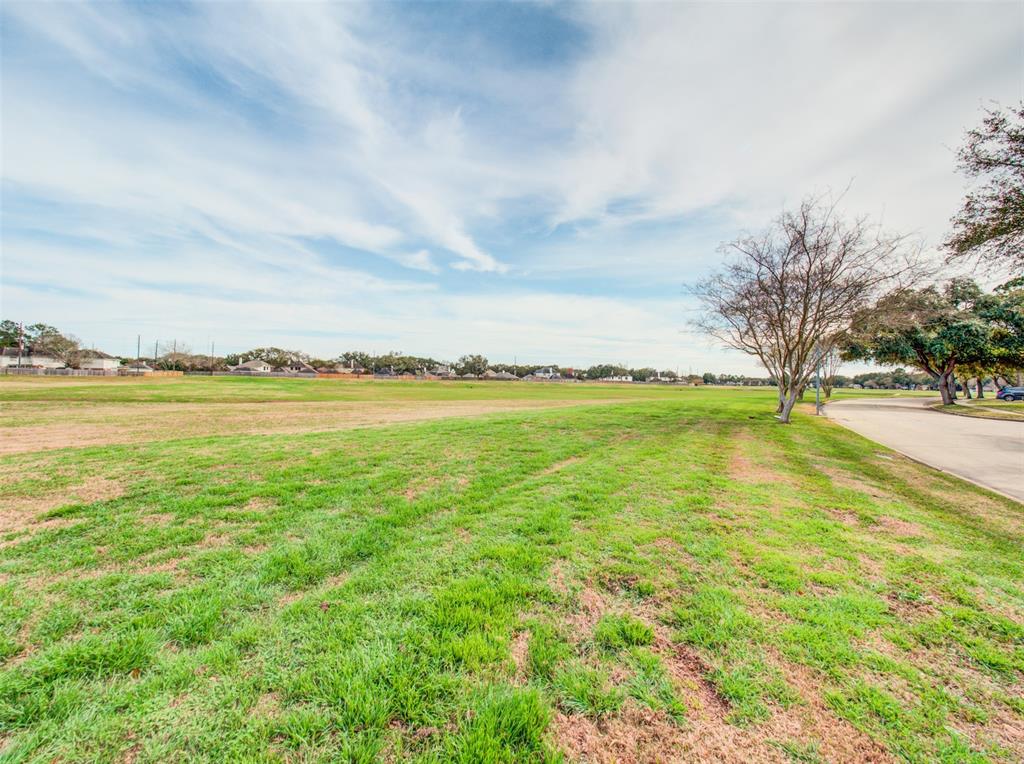
Corner lot facing a large greenbelt for walking your dogs, exercising, kids playing, etc. Large living room, formal dining for your enjoyment. 3 bedrooms and gameroom upstairs. Lots of natural lighting. Easy access to major highways and shopping.
Premium Content
Get full access to Premium Content
Sold Price for nearby listings,
Property History Reports and more.
Sign Up or
Log In Now
General Description
Sold Price Range:
$250,001 - $285,000
Address:
1338 Sheffield Drive
Legal Description:
LEXINGTON COLONY SEC 2, BLOCK 1, LOT 8
Property Type:
Single-Family
Baths:
2 Full & 1 Half Bath(s)
Year Built:
1989 / Appraisal District
Building Sqft.:
1,964 182(m²) /Appraisal District
Lot Size:
8,368 Sqft. 777(m²) /Appraisal District
Maintenance Fee:
$ 870 / Annually
Ready to sell your home?
If you are considering selling your home, you may find out how now. Request your home selling analysis featuring Recently Sold, Market Analysis, Home Valuations and Market Update.
GET STARTED
Room Dimension
Primary Bedroom:
14 x 14, 2nd
Interior Features
Fireplace:
1/Gaslog Fireplace
Bedroom Description:
All Bedrooms Up
Room Description:
1 Living Area, Breakfast Room, Formal Dining, Gameroom Up
Cooling:
Central Electric
Connections:
Gas Dryer Connections, Washer Connections
Exterior Features
Exterior Type:
Brick, Wood
Lot Description:
Subdivision Lot
Water Sewer:
Public Sewer, Public Water, Water District
Unit Location:
Subdivision Lot
Assigned School Information
School information is computer generated and may not be accurate or current. Buyer must independently verify and confirm enrollment. Please contact the school district to determine the schools to which this property is zoned.
Listing Broker: Keller Williams Realty -SW
Email Listing Broker
Selling Broker: RE/MAX Southwest
Last updated as of: 07/03/2024
Property Tax
Market Value Per Appraisal District
Cost/Sqft based on Market Value
Tax Year
Cost/sqft
Market Value
Change
Tax Assessment
Change
2023
$152.42
$299,361
7.54% $299,361
7.54%
2022
$141.73
$278,360
25.75% $278,360
25.75%
2021
$112.71
$221,360
3.28% $221,360
3.28%
2020
$109.13
$214,330
6.59% $214,330
6.59%
2019
$102.38
$201,080
4.55% $201,080
4.55%
2018
$97.92
$192,320
-1.11% $192,320
-1.11%
2017
$99.02
$194,470
-0.57% $194,470
-0.57%
2016
$99.58
$195,580
11.75% $195,580
11.75%
2015
$89.11
$175,020
13.02% $175,020
13.02%
2014
$78.85
$154,860
2.71% $154,860
2.71%
2013
$76.77
$150,780
$150,780
2023 Fort Bend County Appraisal District Tax Value
Market Land Value:
$47,311
Market Improvement Value:
$252,050
Total Market Value : $299,361
2023 Tax Rates
FORT BEND ISD:
0.9892 %
HCC MISSOURI CITY:
0.0922 %
CITY OF MISSOURI CITY:
0.5708 %
FT BEND CO GEN:
0.4265 %
FORT BEND DRNG:
0.0124 %
FIRST COLONY MUD 9:
0.1550 %
FIRST COL LID:
0.1200 %
Total Tax Rate : 2.3662 %