Sold Price Range: $325,001 - $370,000
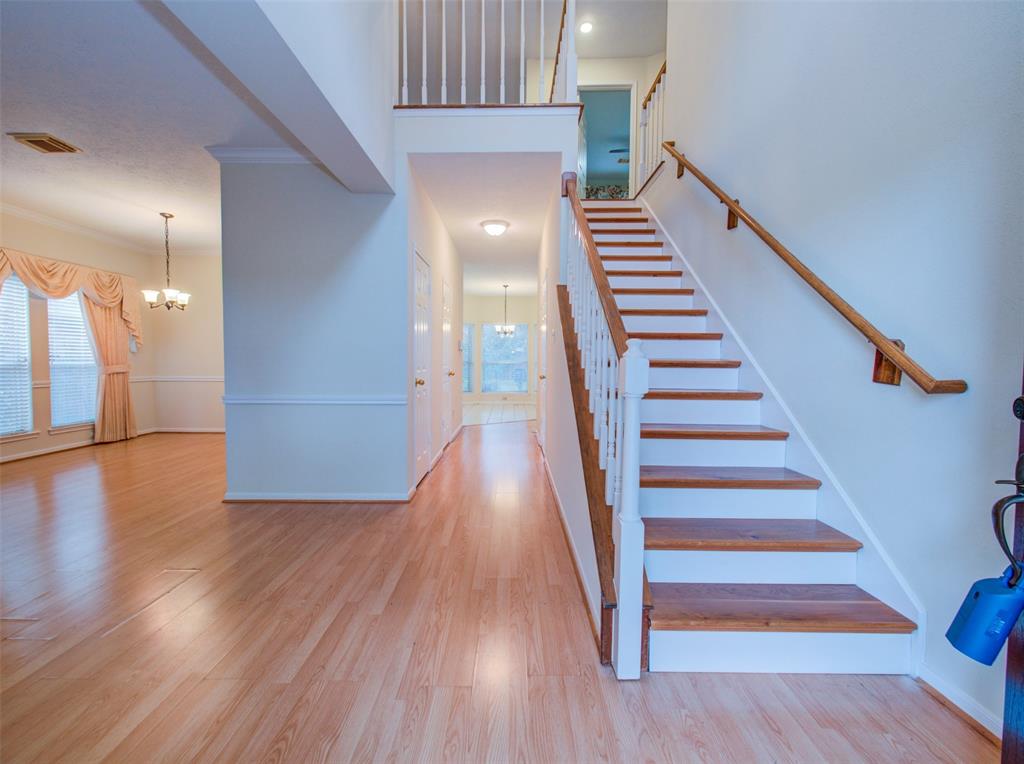
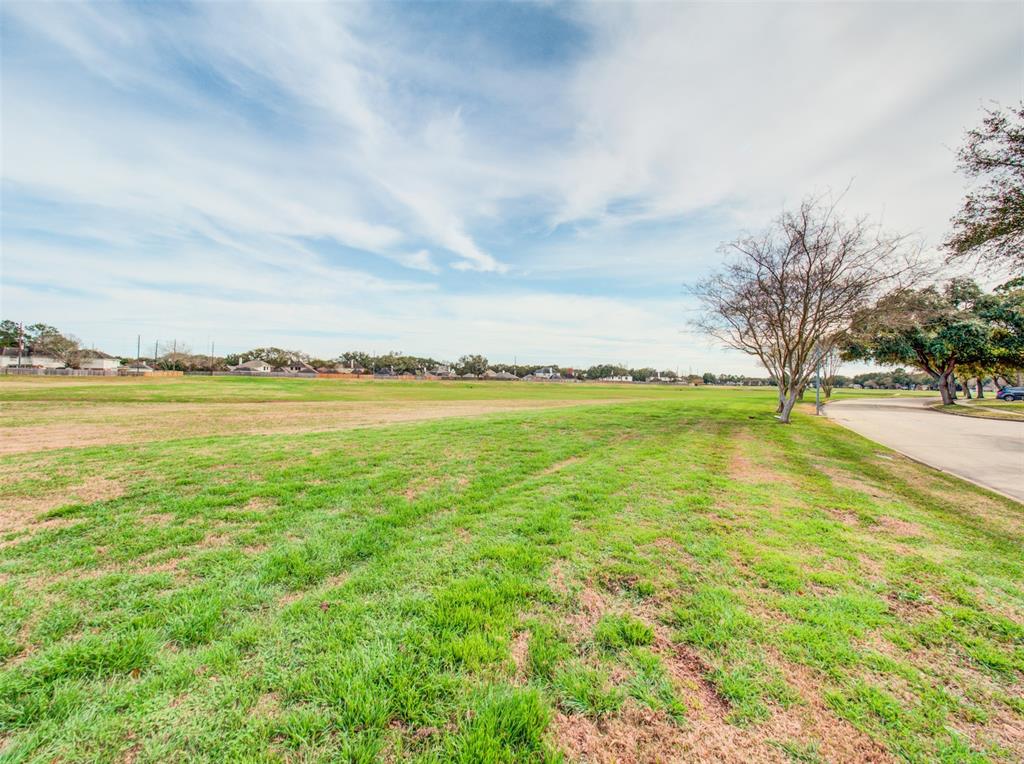
Beautiful property facing a large greenbelt! Spacious interior with living/dining combo. Large kitchen with island, tile backsplash, and breakfast area. Game room upstairs. Laminate flooring downstairs, Engineering wood upstairs and tiles, no carpet.
Premium Content
Get full access to Premium Content
Sold Price for nearby listings,
Property History Reports and more.
Sign Up or
Log In Now
General Description
Sold Price Range:
$325,001 - $370,000
Address:
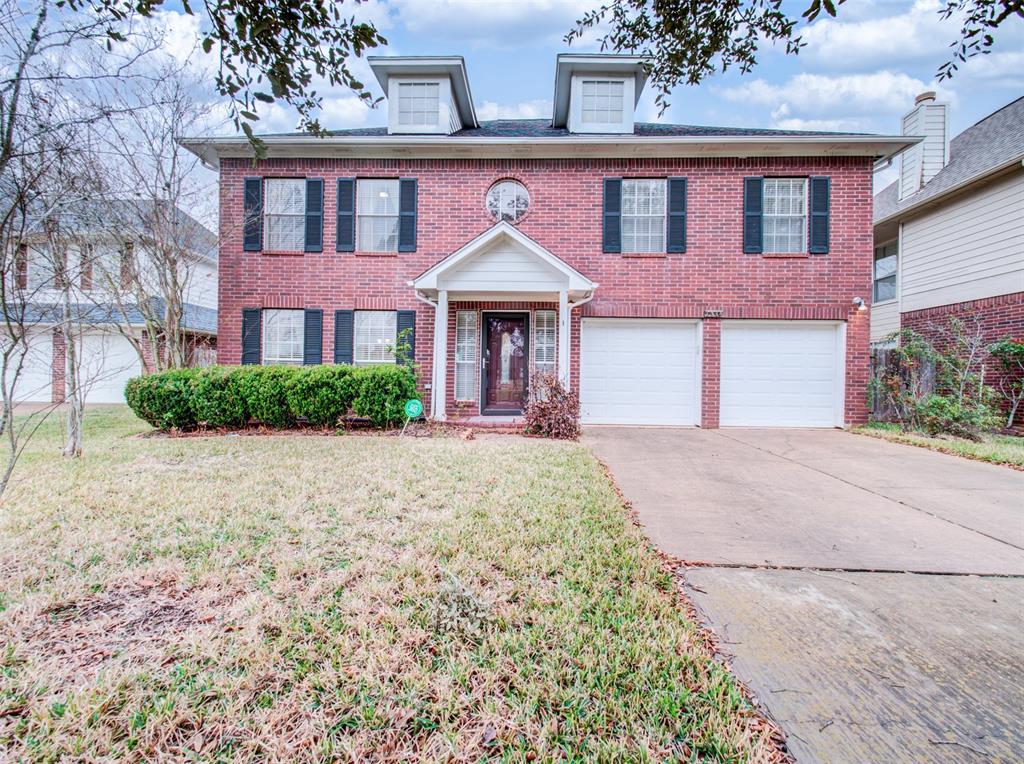
1334 Sheffield Drive
Legal Description:
LEXINGTON COLONY SEC 2, BLOCK 1, LOT 7
Property Type:
Single-Family
Baths:
2 Full & 1 Half Bath(s)
Year Built:
1990 / Appraisal District
Building Sqft.:
2,539 236(m²) /Appraisal District
Lot Size:
6,633 Sqft. 616(m²) /Appraisal District
Maintenance Fee:
$ 800 / Annually
Ready to sell your home?
If you are considering selling your home, you may find out how now. Request your home selling analysis featuring Recently Sold, Market Analysis, Home Valuations and Market Update.
GET STARTED
Room Dimension
Primary Bedroom:
19x13, 2nd
Interior Features
Fireplace:
2/Gaslog Fireplace
Bathroom Description:
Primary Bath: Double Sinks, Primary Bath: Jetted Tub, Primary Bath: Separate Shower
Bedroom Description:
All Bedrooms Up
Room Description:
Breakfast Room, Formal Living, Gameroom Up
Cooling:
Central Electric
Exterior Features
Exterior Type:
Brick, Wood
Lot Description:
Subdivision Lot
Water Sewer:
Public Sewer, Public Water, Water District
Unit Location:
Subdivision Lot
Assigned School Information
School information is computer generated and may not be accurate or current. Buyer must independently verify and confirm enrollment. Please contact the school district to determine the schools to which this property is zoned.
Listing Broker: Keller Williams Realty -SW
Email Listing Broker
Selling Broker: Coldwell Banker Realty - Sugar Land
Last updated as of: 06/27/2024
Property Tax
Market Value Per Appraisal District
Cost/Sqft based on Market Value
Tax Year
Cost/sqft
Market Value
Change
Tax Assessment
Change
2023
$132.93
$337,499
9.42% $337,499
24.66%
2022
$121.48
$308,430
25.32% $270,730
10.00%
2021
$96.94
$246,120
-0.00% $246,120
-0.00%
2020
$96.94
$246,130
6.94% $246,130
6.94%
2019
$90.65
$230,160
3.83% $230,160
3.83%
2018
$87.31
$221,680
-3.59% $221,680
-3.59%
2017
$90.56
$229,930
1.24% $229,930
8.53%
2016
$89.45
$227,120
12.35% $211,850
10.00%
2015
$79.62
$202,160
15.47% $192,590
10.00%
2014
$68.96
$175,080
0.79% $175,080
0.79%
2013
$68.41
$173,700
$173,700
2023 Fort Bend County Appraisal District Tax Value
Market Land Value:
$38,720
Market Improvement Value:
$298,779
Total Market Value : $337,499
2023 Tax Rates
FORT BEND ISD:
0.9892 %
HCC MISSOURI CITY:
0.0922 %
CITY OF MISSOURI CITY:
0.5708 %
FT BEND CO GEN:
0.4265 %
FORT BEND DRNG:
0.0124 %
FIRST COLONY MUD 9:
0.1550 %
FIRST COL LID:
0.1200 %
Total Tax Rate : 2.3662 %