Sold Price Range: $215,001 - $250,000
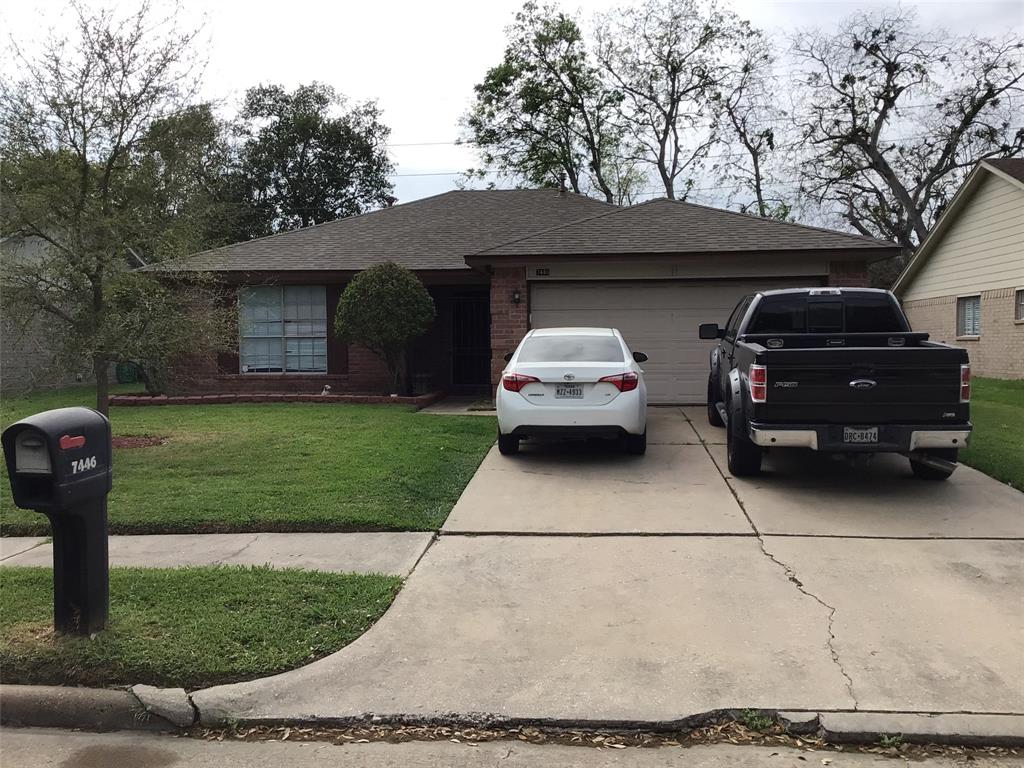
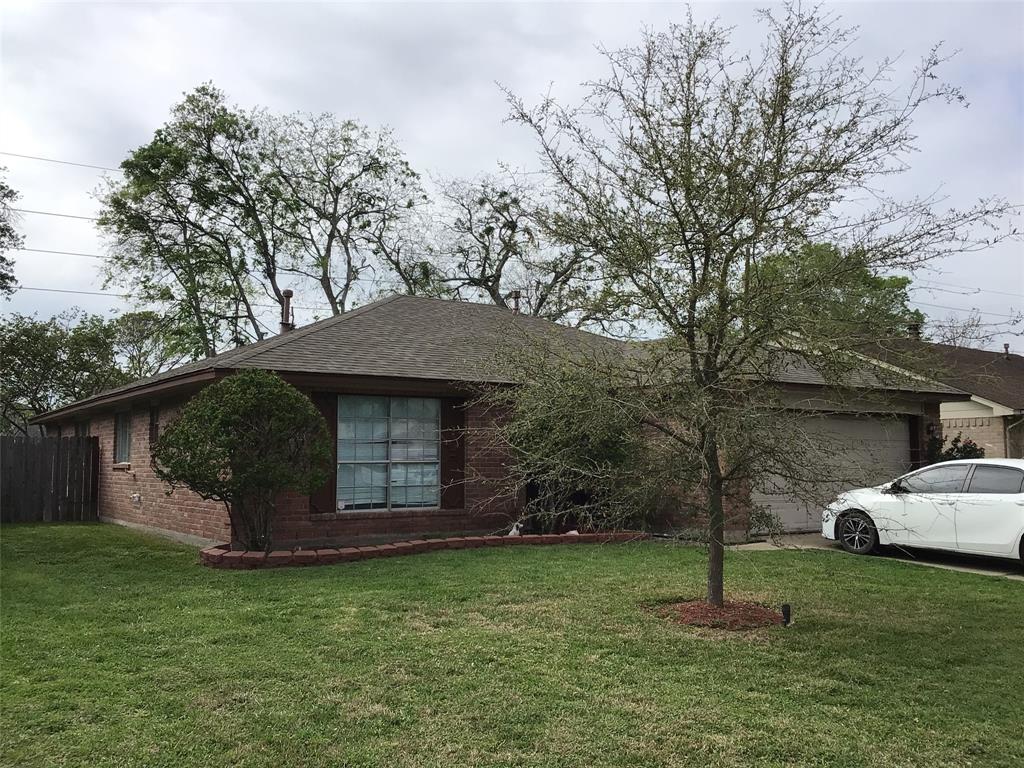
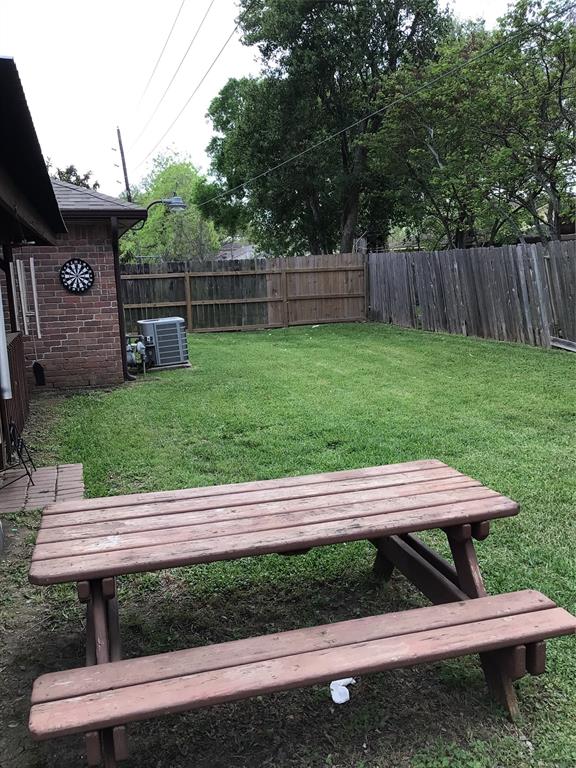
Home ready to be loved and turned into your dream home, needs TLC to give life again, 3 Bedrooms, 2 Baths, Tile Floor, carpet on the bedrooms, Room dimensions APPROX, nice back yard with cover patio,
Premium Content
Get full access to Premium Content
Sold Price for nearby listings,
Property History Reports and more.
Sign Up or
Log In Now
General Description
Sold Price Range:
$215,001 - $250,000
Address:
7446 Soledad Drive
Legal Description:
MISSION BEND SOUTH SEC3, BLOCK 1, LOT 11
Property Type:
Single-Family
Year Built:
1980 / Appraisal District
Building Sqft.:
1,518 141(m²) /Appraisal District
Lot Size:
6,340 Sqft. 589(m²) /Appraisal District
Maintenance Fee:
$ 423 / Annually
Ready to sell your home?
If you are considering selling your home, you may find out how now. Request your home selling analysis featuring Recently Sold, Market Analysis, Home Valuations and Market Update.
GET STARTED
Room Dimension
Primary Bedroom:
15X15, 1st
Interior Features
Fireplace:
1/Gas Connections
Bathroom Description:
Primary Bath: Double Sinks, Primary Bath: Separate Shower, Secondary Bath(s): Tub/Shower Combo
Bedroom Description:
All Bedrooms Down
Kitchen Description:
Pantry
Room Description:
1 Living Area
Cooling:
Central Electric
Connections:
Electric Dryer Connections, Gas Dryer Connections, Washer Connections
Range:
Freestanding Range, Gas Range
Exterior Features
Lot Description:
Subdivision Lot
Water Sewer:
Public Sewer, Public Water
Unit Location:
Subdivision Lot
Assigned School Information
School information is computer generated and may not be accurate or current. Buyer must independently verify and confirm enrollment. Please contact the school district to determine the schools to which this property is zoned.
Listing Broker: MICASAPOSIBLE
Email Listing Broker
Selling Broker: RE/MAX EXCLUSIVE
Last updated as of: 07/03/2024
Property Tax
Market Value Per Appraisal District
Cost/Sqft based on Market Value
Tax Year
Cost/sqft
Market Value
Change
Tax Assessment
Change
2023
$167.83
$254,769
26.17% $191,466
10.00%
2022
$133.02
$201,920
27.60% $174,060
10.00%
2021
$104.24
$158,240
2.81% $158,240
5.73%
2020
$101.39
$153,910
8.98% $149,660
10.00%
2019
$93.04
$141,230
4.19% $136,050
10.00%
2018
$89.30
$135,550
10.23% $123,680
10.00%
2017
$81.01
$122,970
6.74% $112,440
10.00%
2016
$75.89
$115,200
7.66% $102,220
10.00%
2015
$70.49
$107,000
26.66% $92,930
10.00%
2014
$55.65
$84,480
10.00% $84,480
10.00%
2013
$50.59
$76,800
$76,800
2023 Fort Bend County Appraisal District Tax Value
Market Land Value:
$54,150
Market Improvement Value:
$200,619
Total Market Value : $254,769
2023 Tax Rates
FORT BEND ISD:
0.9892 %
FT BEND CO GEN:
0.4265 %
FORT BEND DRNG:
0.0124 %
HARRIS-FT BEND ESD 100:
0.0853 %
CHELFORD CITY MUD:
0.3130 %
Total Tax Rate : 1.8264 %