Sold Price Range: $185,001 - $215,000
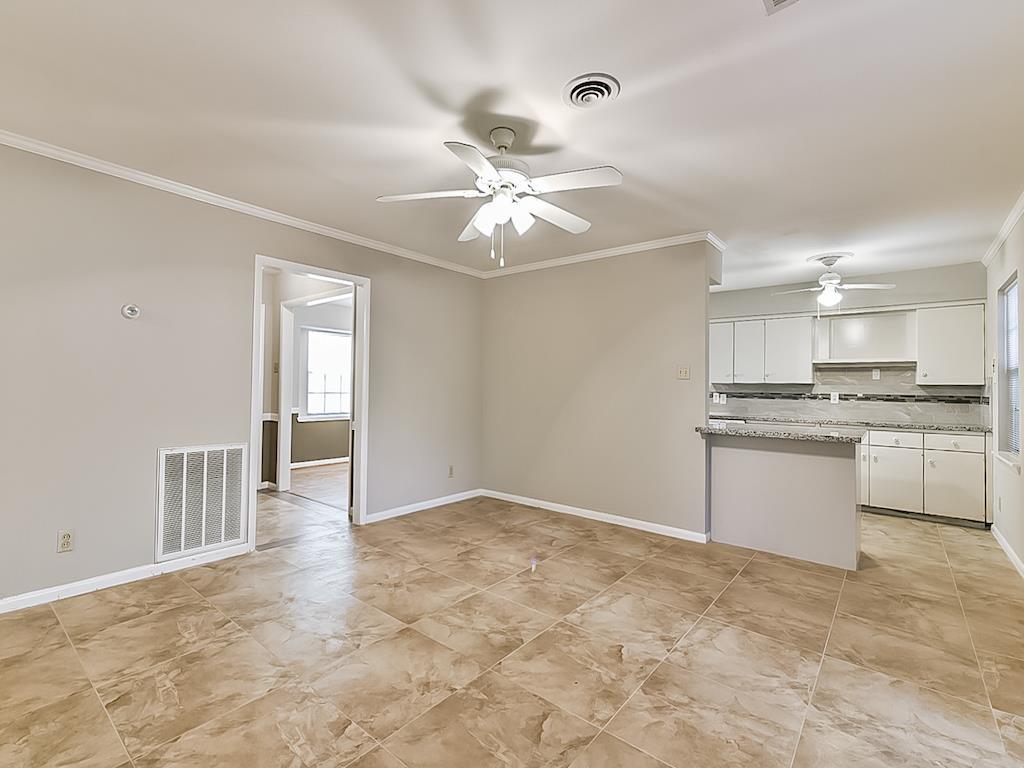
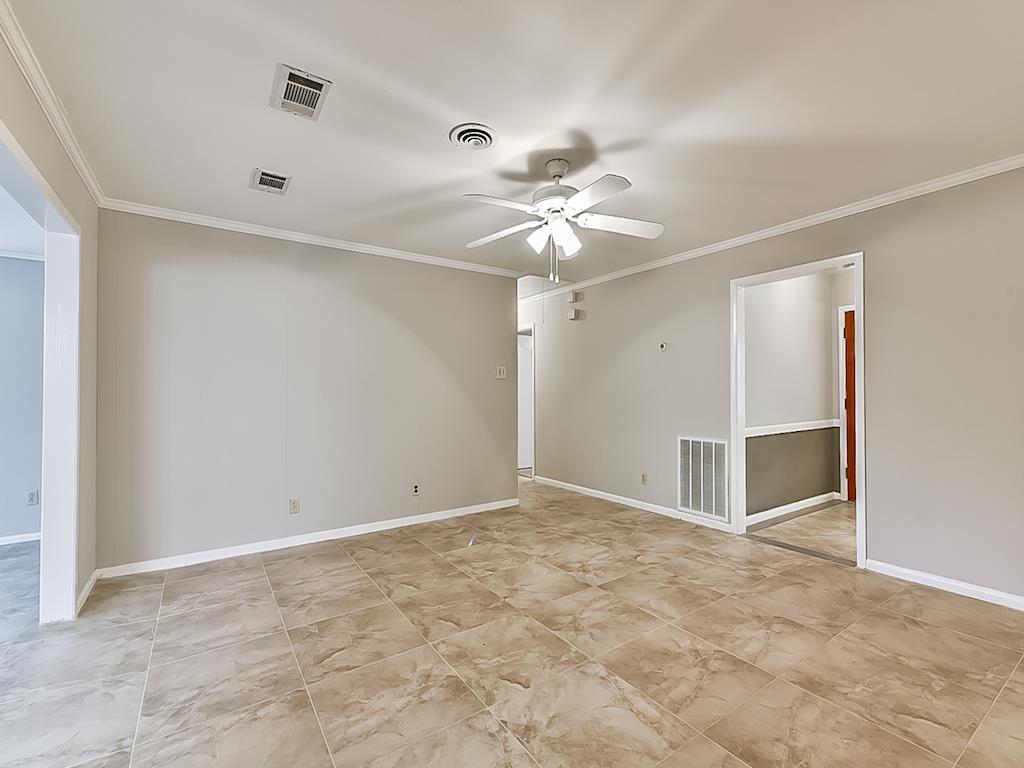
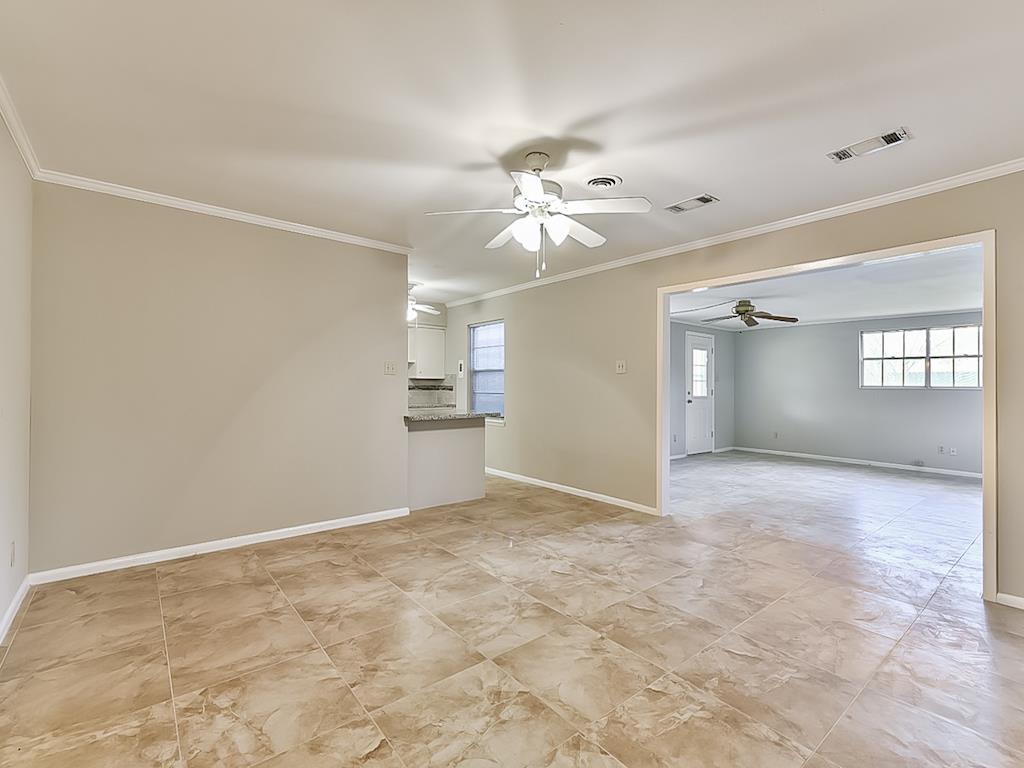
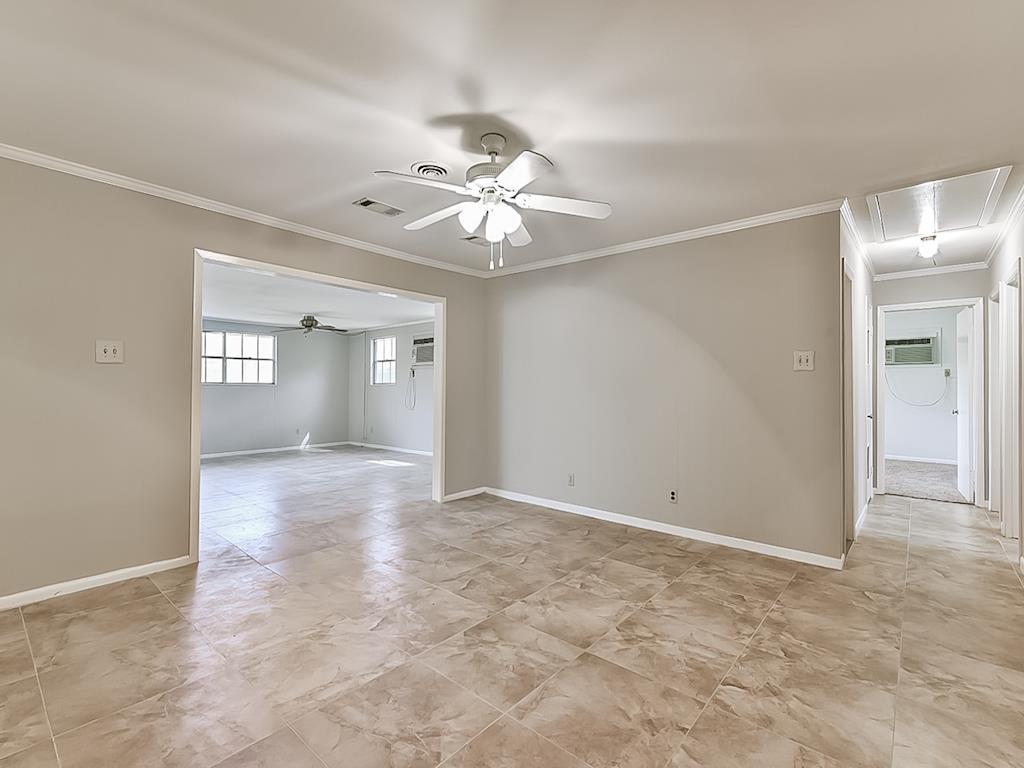
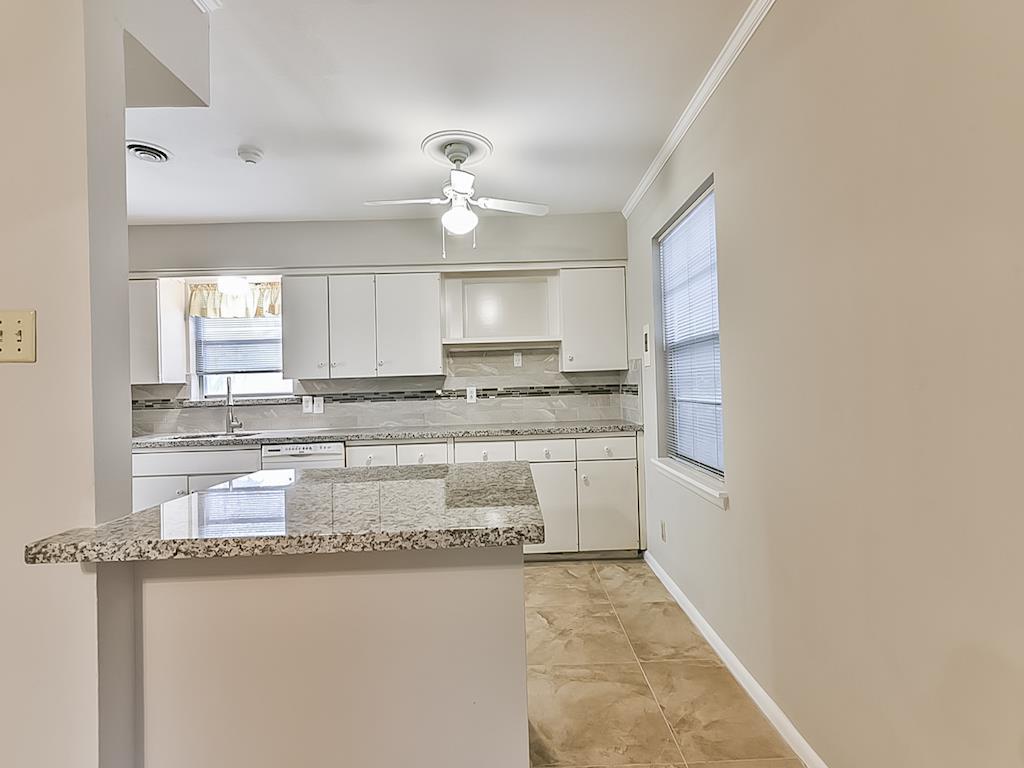
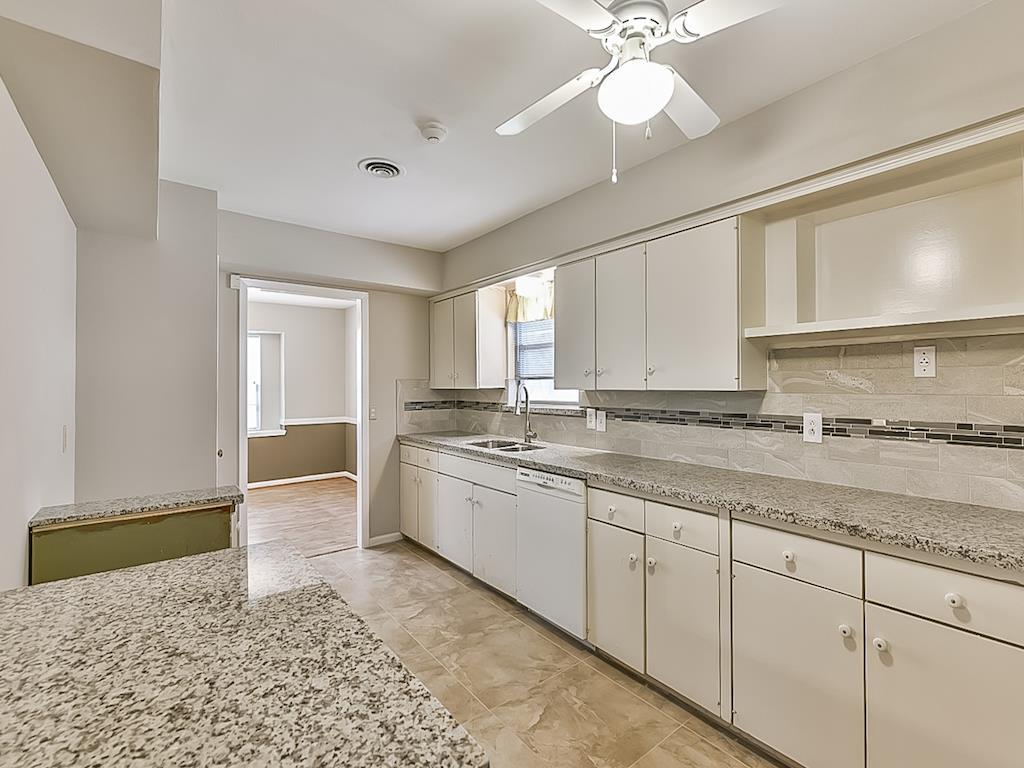
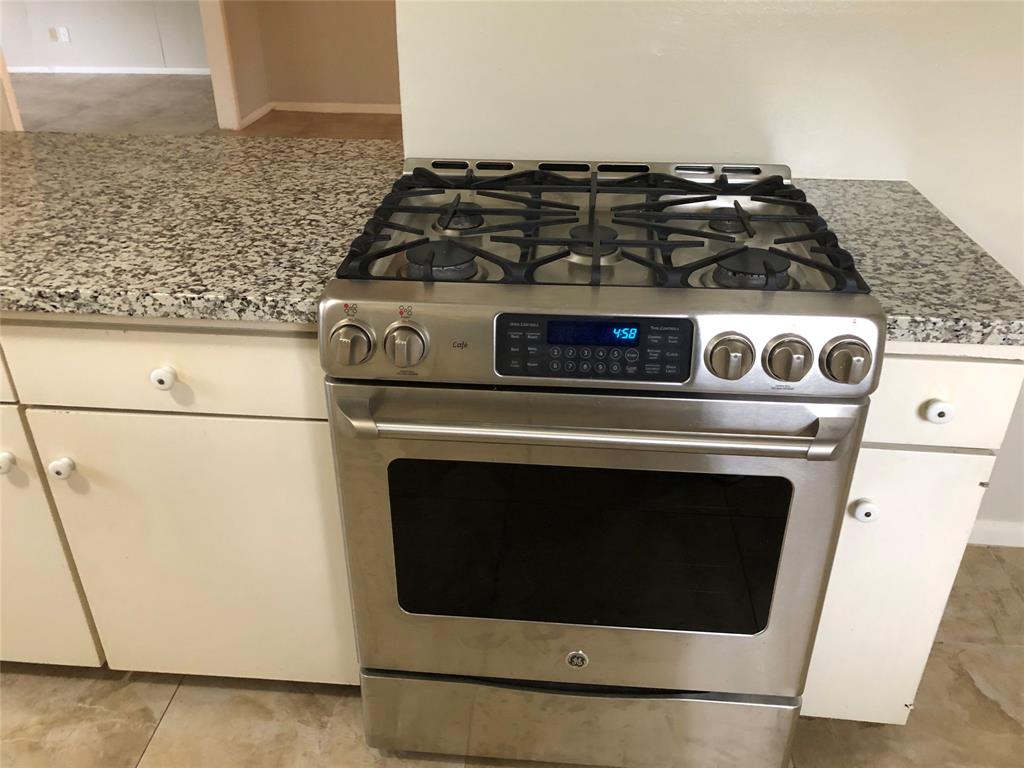
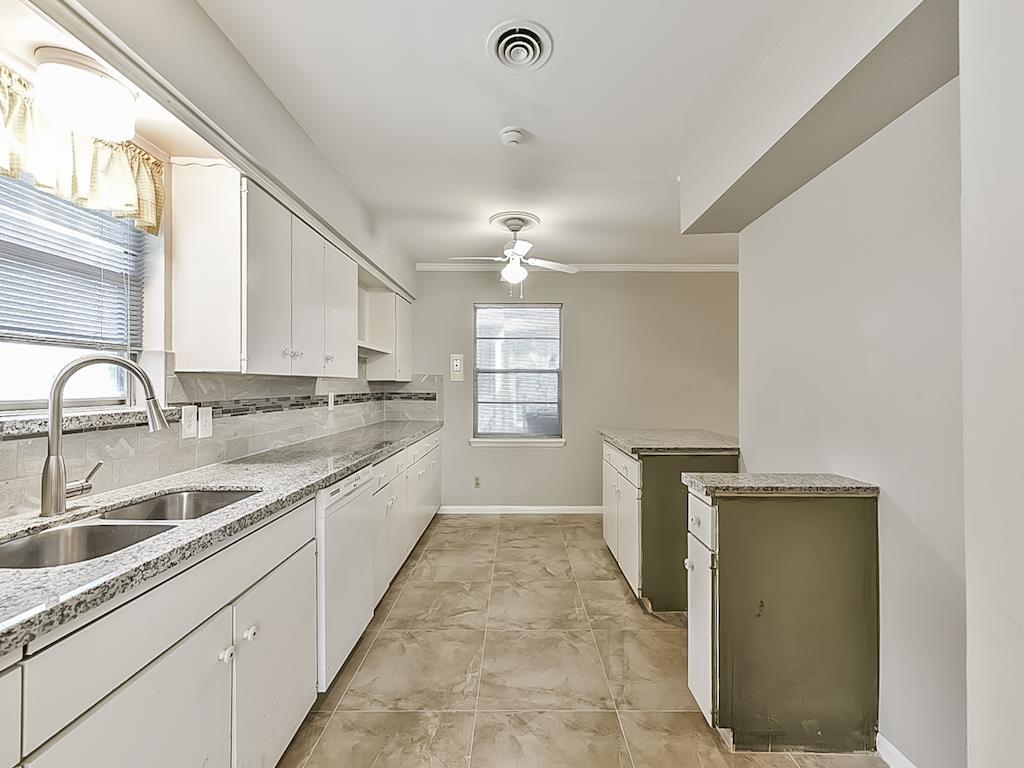
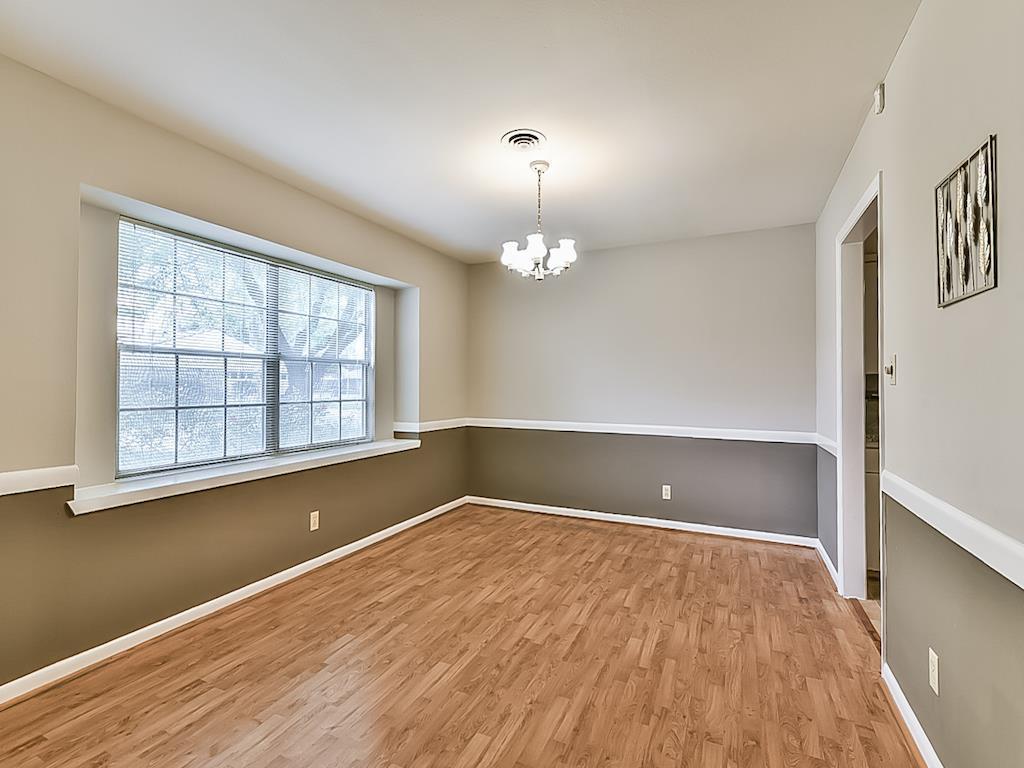
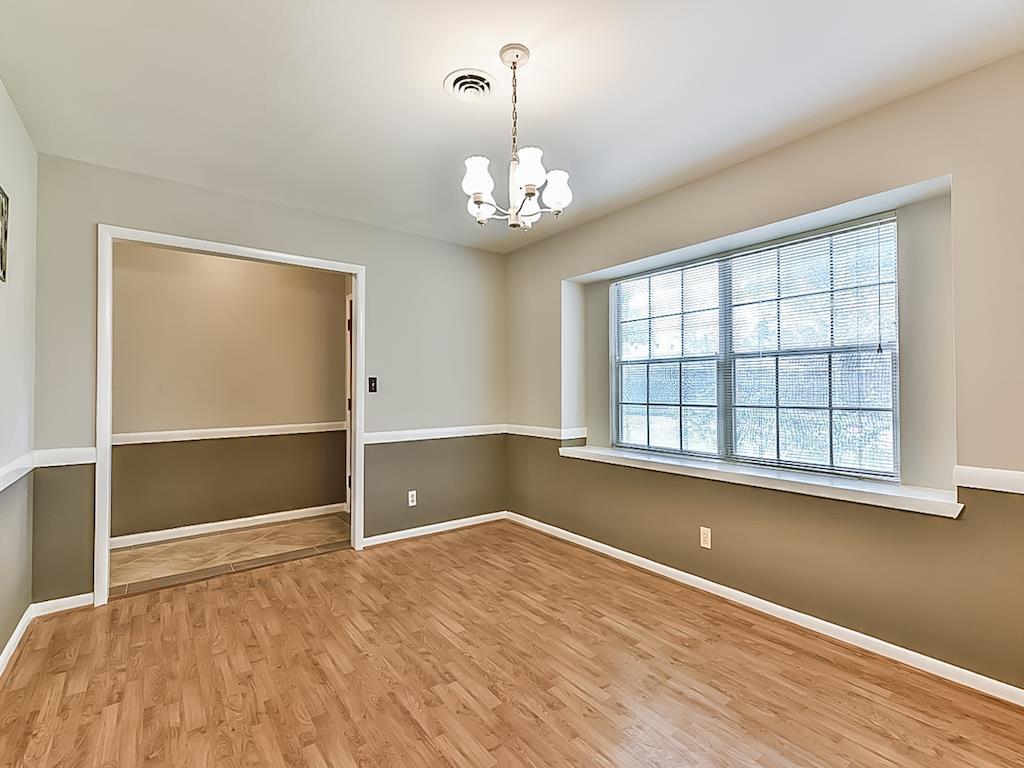
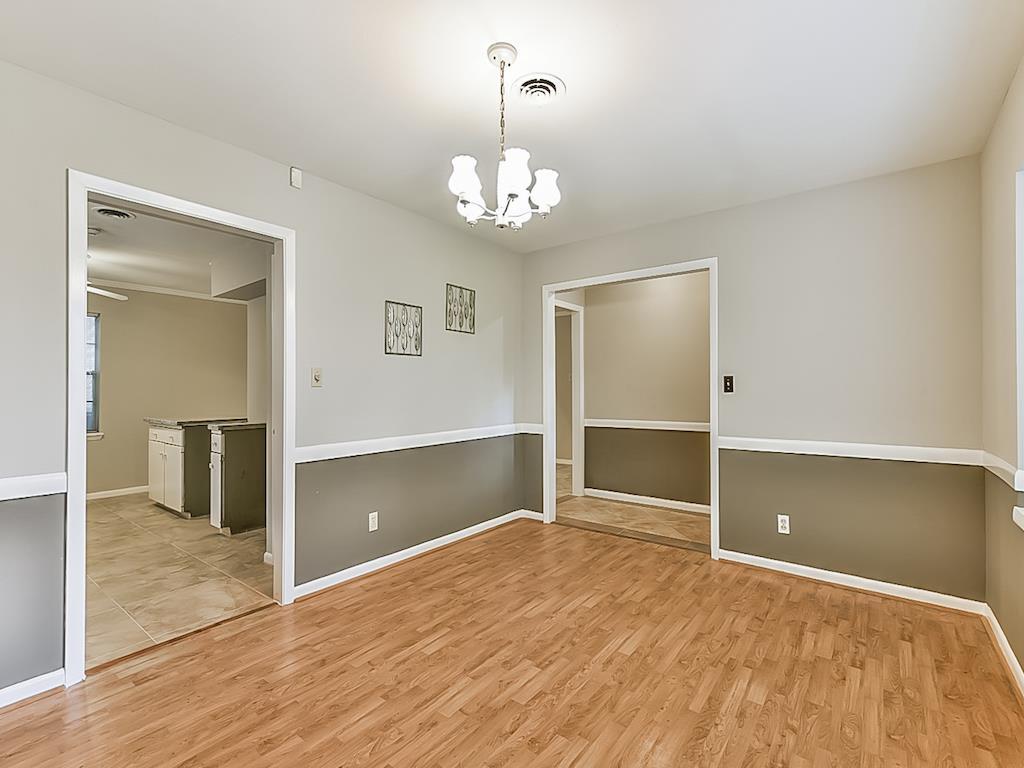
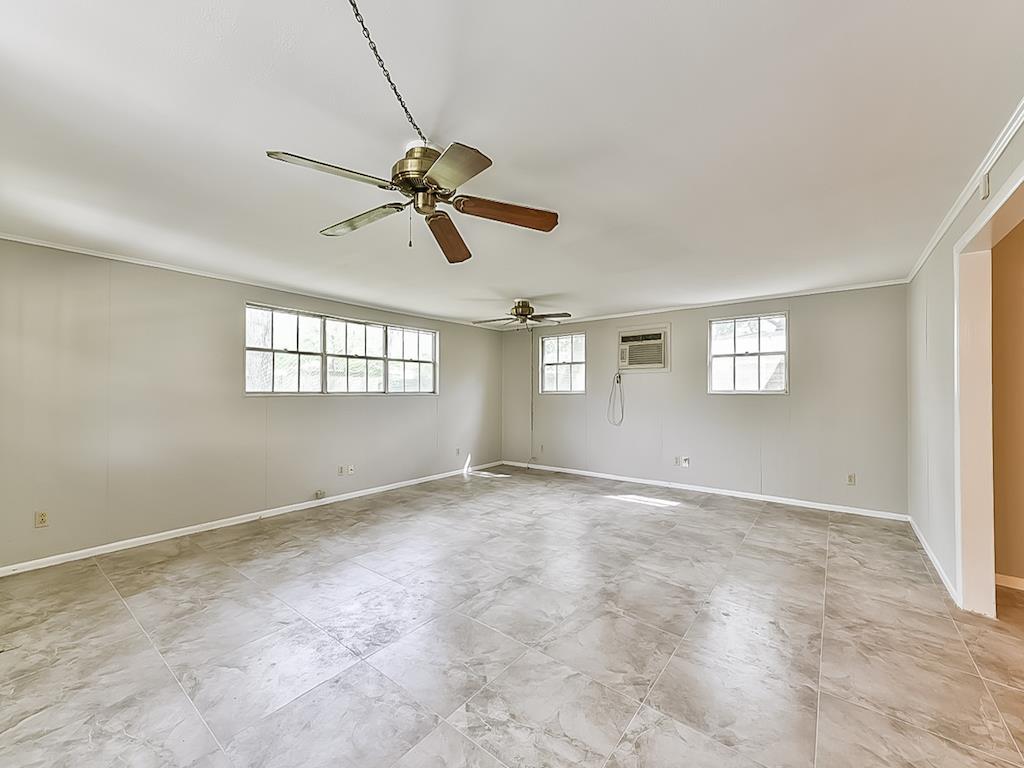
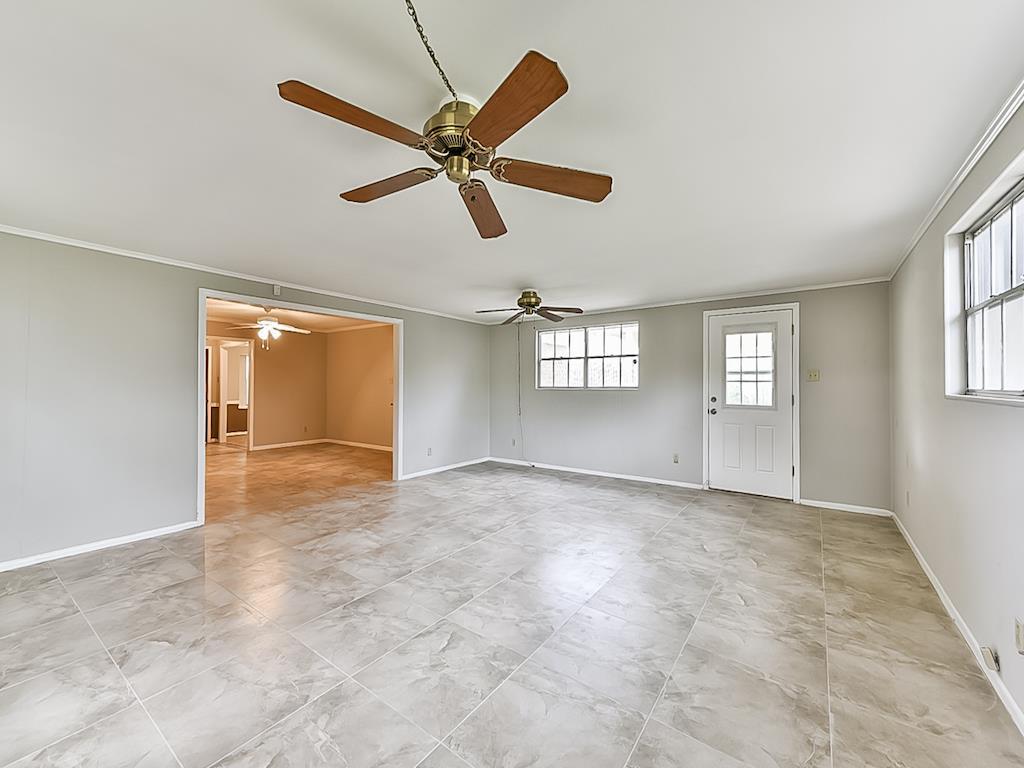
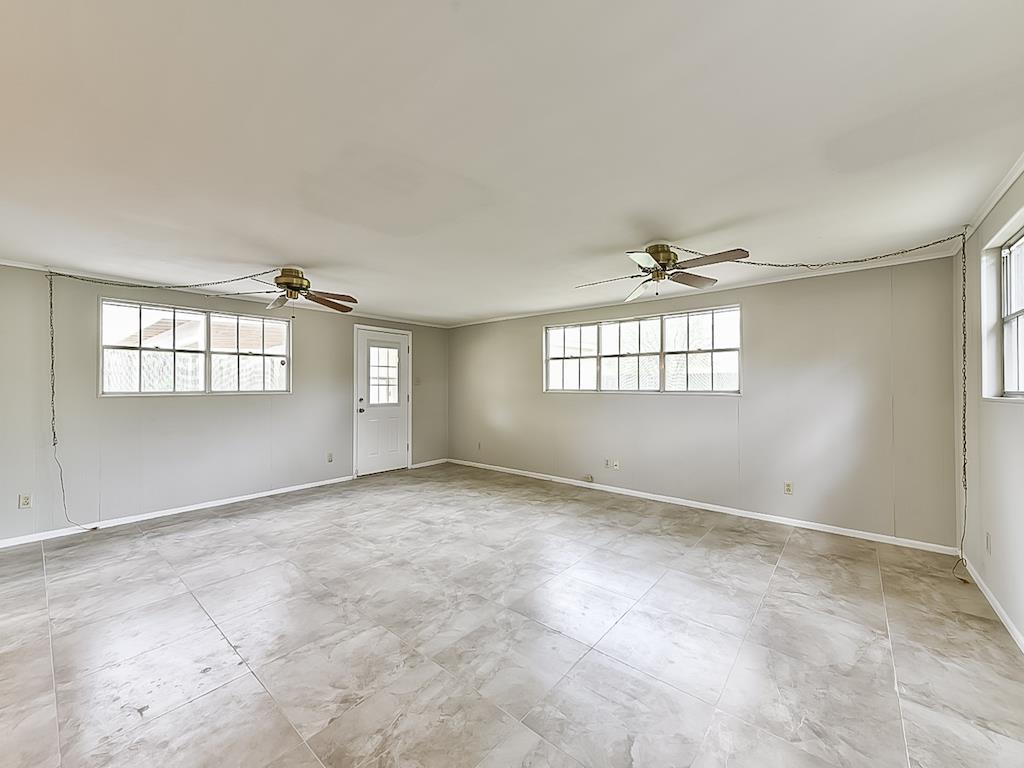
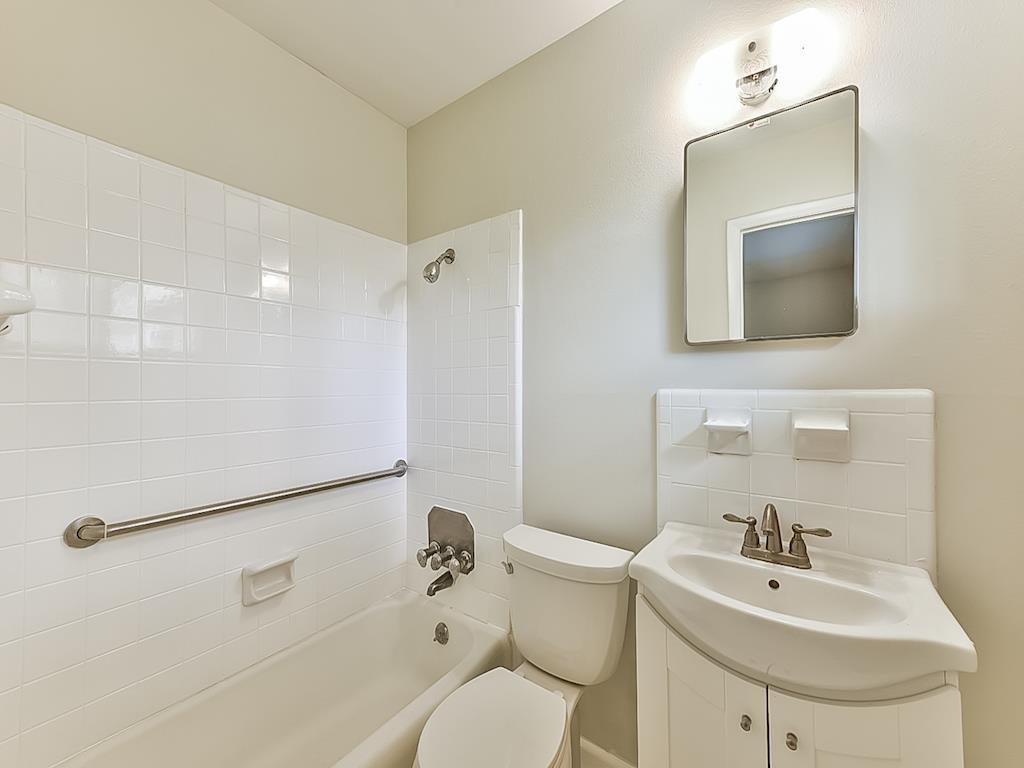
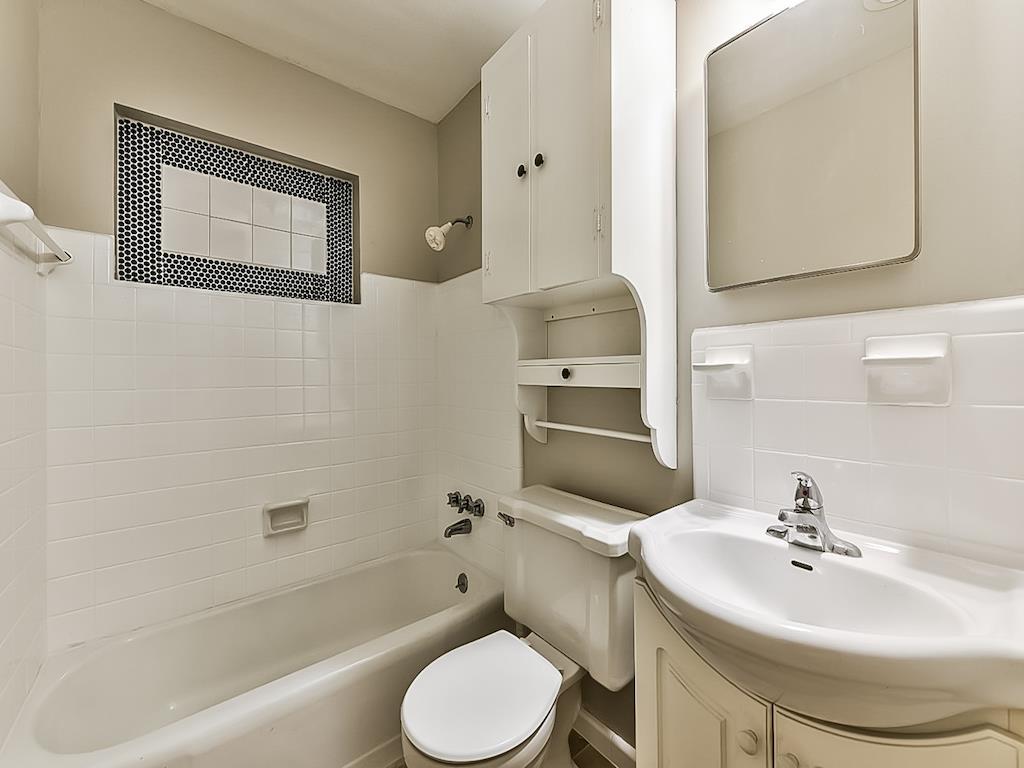
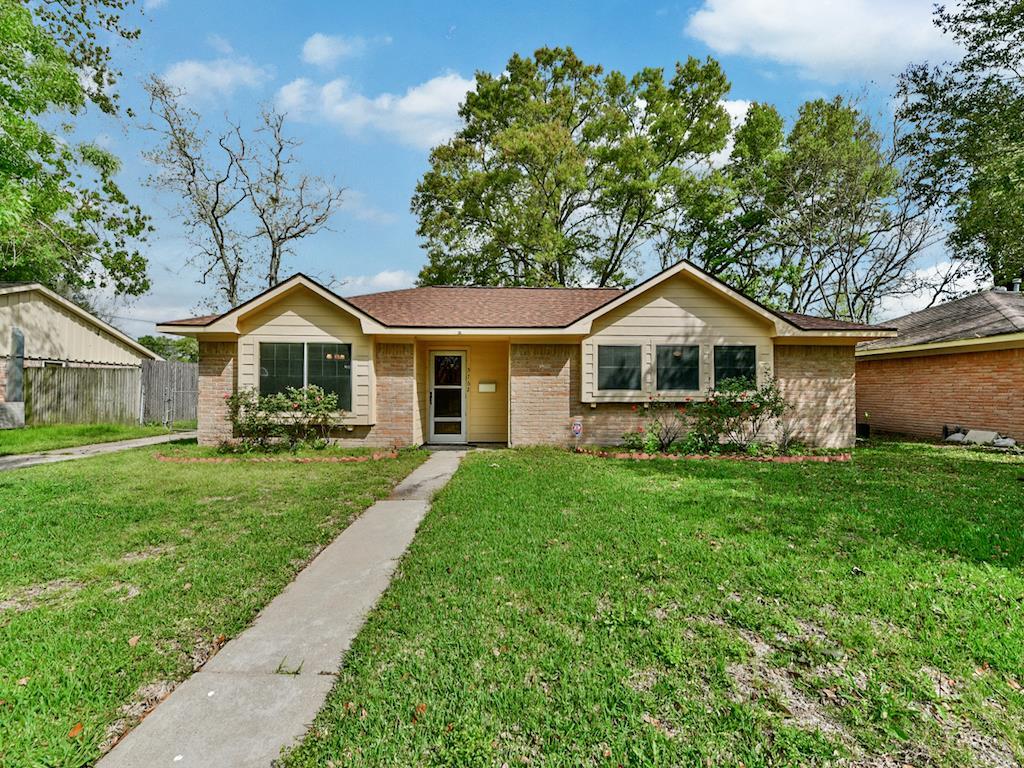
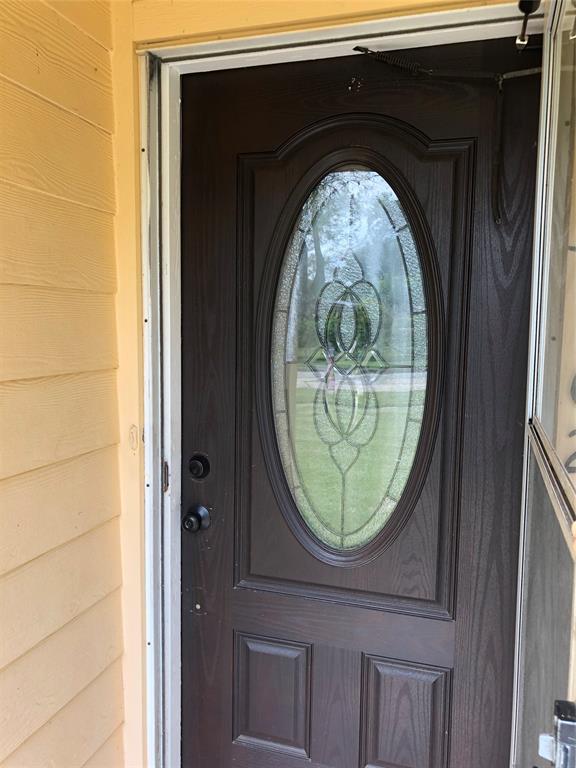
NEVER FLOODED! LOVELY REMODELED 3/2/2, ONE STORY HOME. UPGRADES: 2019-NEW SEWER LINE, BEDROOMS WOOD FLOOR; 2018-AC UNIT, INTERIOR NEW PAINT. HOME FEATURES WOOD AND TILE FLOOR, NO CARPET, GRANITE COUNTER TOPS AND BACK SPLASH, NEW FAUCETS; BATHROOMS REFINISHED. CENTRAL AC THRU THE HOME, A WINDOW UNIT INSTALLED PER PREVIOUS OWNER REQUEST. GREAT INVESTMENT OPPORTUNITY TOO! PRICED TO SALE! MOVE IN READY.
Premium Content
Get full access to Premium Content
Sold Price for nearby listings,
Property History Reports and more.
Sign Up or
Log In Now
General Description
Sold Price Range:
$185,001 - $215,000
Address:
5762 Fontenelle Drive
Legal Description:
LT 33 BLK 125 WESTBURY SOUTH
Property Type:
Single-Family
Bedrooms:
3 - 4 Bedroom(s)
Year Built:
1960 / Appraisal District
Building Sqft.:
1,789 166(m²) /Appraisal District
Lot Size:
8,520 Sqft. 792(m²) /Appraisal District
Ready to sell your home?
If you are considering selling your home, you may find out how now. Request your home selling analysis featuring Recently Sold, Market Analysis, Home Valuations and Market Update.
GET STARTED
Interior Features
Kitchen Description:
Island w/o Cooktop
Bedroom Description:
All Bedrooms Down
Bathroom Description:
Primary Bath + Separate Shower
Cooling:
Central Electric
Connections:
Electric Dryer Connections, Washer Connections
Exterior Features
Exterior Type:
Brick, Wood
Lot Description:
Subdivision Lot
Water Sewer:
Public Sewer, Public Water
Unit Location:
Subdivision Lot
Exterior:
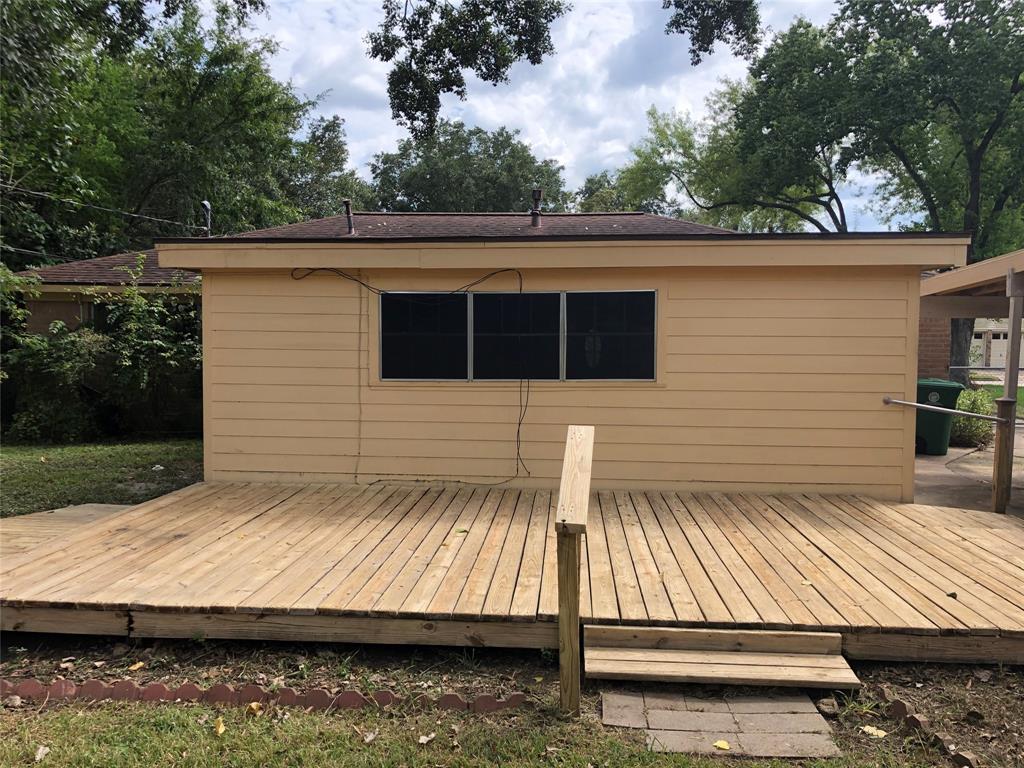
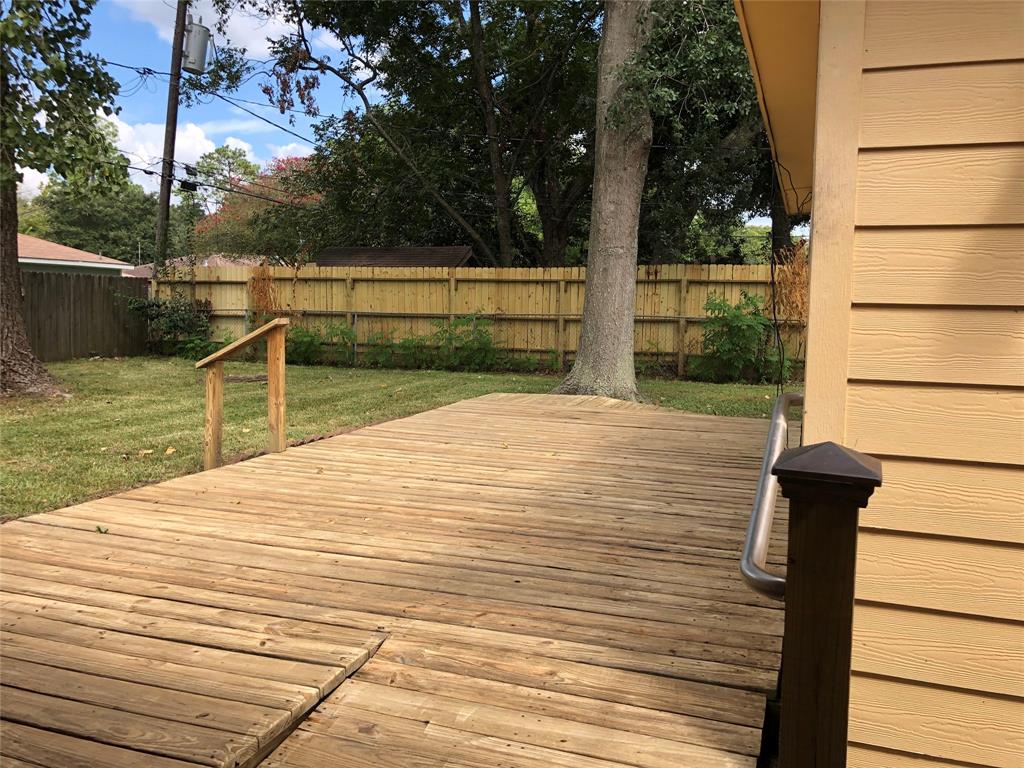
Back Yard Fenced, Patio/Deck
Assigned School Information
School information is computer generated and may not be accurate or current. Buyer must independently verify and confirm enrollment. Please contact the school district to determine the schools to which this property is zoned.
Listing Broker: Keller Williams Realty -SW
Email Listing Broker
Selling Broker: Ceno Realty Group
Last updated as of: 07/17/2024
Property Tax
Market Value Per Appraisal District
Cost/Sqft based on Market Value
Tax Year
Cost/sqft
Market Value
Change
Tax Assessment
Change
2023
$153.08
$273,864
13.59% $273,864
13.59%
2022
$134.76
$241,089
16.26% $241,089
16.26%
2021
$115.91
$207,366
30.75% $207,366
30.75%
2020
$88.65
$158,600
-7.79% $158,600
-7.79%
2019
$96.14
$172,000
1.68% $172,000
1.68%
2018
$94.56
$169,166
0.00% $169,166
0.00%
2017
$94.56
$169,166
9.15% $169,166
49.28%
2016
$86.63
$154,986
2.80% $113,325
10.00%
2015
$84.27
$150,763
27.16% $103,023
10.00%
2014
$66.27
$118,563
39.25% $93,658
10.00%
2013
$47.59
$85,144
0.00% $85,144
0.00%
2012
$47.59
$85,144
$85,144
2023 Harris County Appraisal District Tax Value
Market Land Value:
$62,880
Market Improvement Value:
$210,984
Total Market Value : $273,864
2023 Tax Rates
HOUSTON ISD:
0.8683 %
HARRIS COUNTY:
0.3501 %
HC FLOOD CONTROL DIST:
0.0311 %
PORT OF HOUSTON AUTHORITY:
0.0057 %
HC HOSPITAL DIST:
0.1434 %
HC DEPARTMENT OF EDUCATION:
0.0048 %
HOUSTON COMMUNITY COLLEGE:
0.0922 %
HOUSTON CITY OF:
0.5192 %
HC ID 5:
0.1000 %
Total Tax Rate : 2.1148 %