Sold Price Range: $285,001 - $325,000
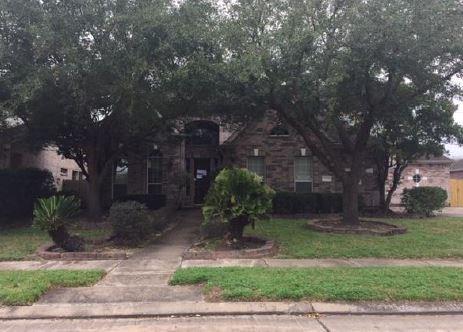
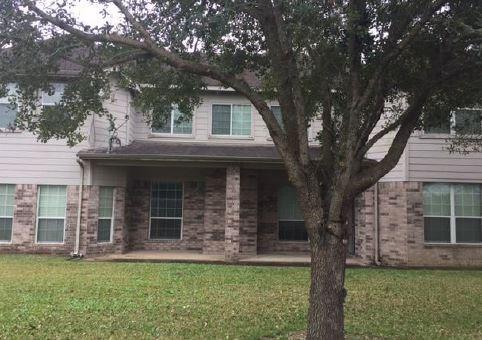
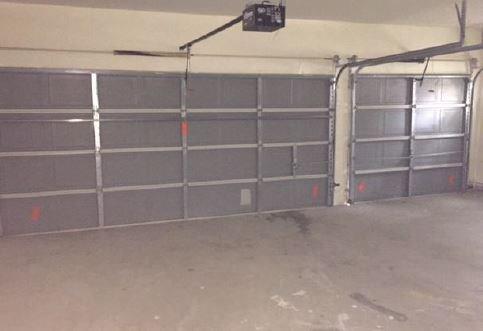
Here's your chance to buy this spacious, approx. 3,685 sqft. home in Sugar Land and conveniently located close to shopping, parks, and schools. Features include 3-car garage, living room with fireplace, island in kitchen, game room and more. Come take a look!
Premium Content
Get full access to Premium Content
Sold Price for nearby listings,
Property History Reports and more.
Sign Up or
Log In Now
General Description
Sold Price Range:
$285,001 - $325,000
Address:
15235 Black Falls Lane
Legal Description:
WOODBRIDGE ESTATES SEC 1, BLOCK 1, LOT 2
Property Type:
Single-Family
Baths:
3 Full & 1 Half Bath(s)
Year Built:
2004 / Appraisal
Building Sqft.:
3,685 342(m²) /Appraisal
Lot Size:
11,900 Sqft. 1,106(m²) /Appraisal District
Maintenance Fee:
$ 1042 / Annually
Ready to sell your home?
If you are considering selling your home, you may find out how now. Request your home selling analysis featuring Recently Sold, Market Analysis, Home Valuations and Market Update.
GET STARTED
Room Dimension
Primary Bedroom:
14x15, 2nd
Interior Features
Cooling:
Central Electric
Exterior Features
Lot Description:
Subdivision Lot
Water Sewer:
Public Sewer, Public Water
Unit Location:
Subdivision Lot
Assigned School Information
School information is computer generated and may not be accurate or current. Buyer must independently verify and confirm enrollment. Please contact the school district to determine the schools to which this property is zoned.
Listing Broker: RealHome Services & Solutions
Email Listing Broker
Selling Broker: REALM Real Estate Professionals - Galleria
Last updated as of: 07/22/2024
Property Tax
Market Value Per Appraisal District
Cost/Sqft based on Market Value
Tax Year
Cost/sqft
Market Value
Change
Tax Assessment
Change
2023
$130.38
$480,434
6.77% $480,434
6.77%
2022
$122.11
$449,990
23.23% $449,990
23.23%
2021
$99.10
$365,170
0.12% $365,170
0.12%
2020
$98.98
$364,740
12.11% $364,740
12.11%
2019
$88.29
$325,340
-4.21% $325,340
-4.21%
2018
$92.17
$339,640
1.51% $339,640
1.51%
2017
$90.80
$334,590
-2.06% $334,590
-2.06%
2016
$92.71
$341,620
-0.45% $341,620
-0.45%
2015
$93.13
$343,170
3.74% $343,170
3.74%
2014
$89.77
$330,810
0.52% $330,810
0.52%
2013
$89.31
$329,090
$329,090
2023 Fort Bend County Appraisal District Tax Value
Market Land Value:
$67,000
Market Improvement Value:
$413,434
Total Market Value : $480,434
2023 Tax Rates
FT BEND MUD 119:
0.4500 %
FORT BEND ISD:
0.9892 %
FT BEND CO GEN:
0.4265 %
FORT BEND DRNG:
0.0124 %
FT BEND CO ESD 5:
0.0862 %
Total Tax Rate : 1.9643 %