Sold Price Range: $285,001 - $325,000
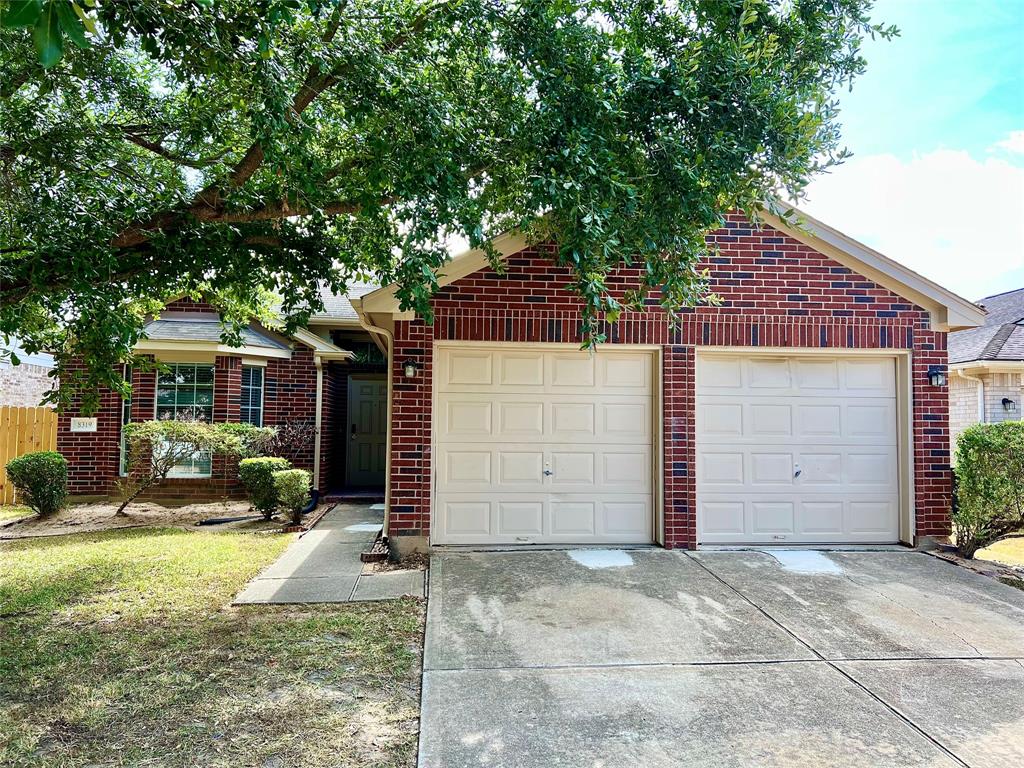
Location ! Location ! Location. Beautiful 1 story home in a quiet neighborhood. 4 Beds w/ 3 FULL baths. Granite Counter Top. Standing showers. Fresh paint. High Ceiling. Lots of natural light. Easy access from Highway 6, I-10, 59. Close to super markets, Restaurants, Schools... LOW TAX RATE 2.1
Premium Content
Get full access to Premium Content
Sold Price for nearby listings,
Property History Reports and more.
Sign Up or
Log In Now
General Description
Sold Price Range:
$285,001 - $325,000
Address:
8319 Castle Crest Ct
Legal Description:
KINGSBRIDGE COURT SEC 2, BLOCK 3, LOT 104
Property Type:
Single-Family
Year Built:
2003 / Appraisal District
Building Sqft.:
1,658 154(m²) /Appraisal District
Lot Size:
5,115 Sqft. 475(m²) /Appraisal District
Maintenance Fee:
$ 450 / Annually
Ready to sell your home?
If you are considering selling your home, you may find out how now. Request your home selling analysis featuring Recently Sold, Market Analysis, Home Valuations and Market Update.
GET STARTED
Room Dimension
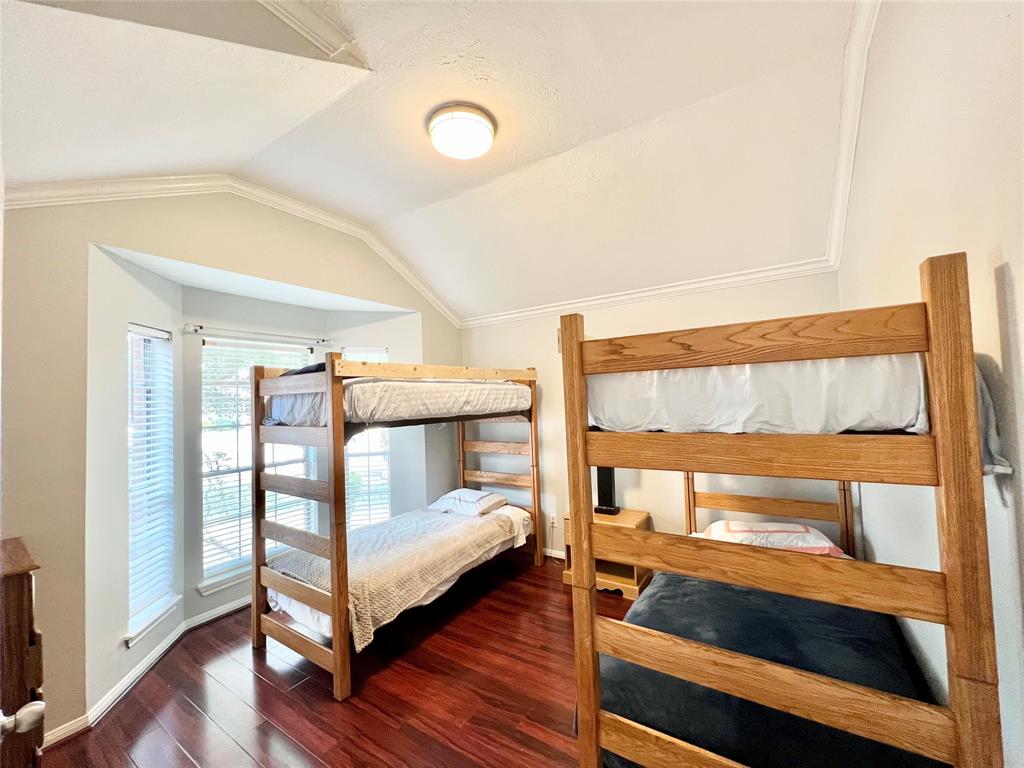
Primary Bedroom:
14x12, 1st
Interior Features
Cooling:
Central Electric
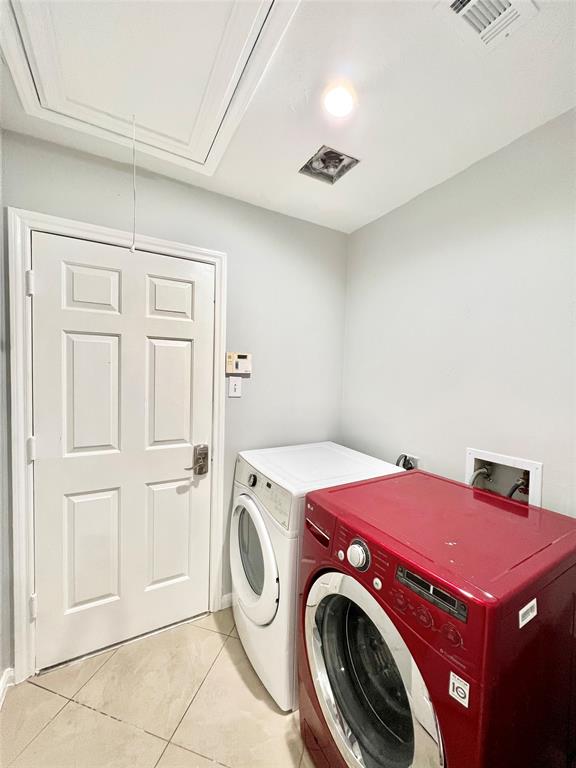
Connections:
Electric Dryer Connections, Gas Dryer Connections, Washer Connections
Exterior Features
Lot Description:
Cul-De-Sac
Water Sewer:
Water District
Assigned School Information
School information is computer generated and may not be accurate or current. Buyer must independently verify and confirm enrollment. Please contact the school district to determine the schools to which this property is zoned.
Listing Broker: The Nguyens & Associates
Email Listing Broker
Selling Broker: REALM Real Estate Professionals - Sugar Land
Last updated as of: 07/23/2024
Property Tax
Market Value Per Appraisal District
Cost/Sqft based on Market Value
Tax Year
Cost/sqft
Market Value
Change
Tax Assessment
Change
2023
$165.53
$274,451
9.22% $274,451
9.22%
2022
$151.56
$251,280
24.65% $251,280
24.65%
2021
$121.59
$201,590
8.51% $201,590
8.51%
2020
$112.05
$185,780
5.19% $185,780
5.19%
2019
$106.52
$176,610
3.35% $176,610
3.35%
2018
$103.07
$170,890
-0.97% $170,890
-0.97%
2017
$104.08
$172,560
4.04% $172,560
4.04%
2016
$100.04
$165,860
18.15% $165,860
18.15%
2015
$84.67
$140,380
20.21% $140,380
20.21%
2014
$70.43
$116,780
7.58% $116,780
7.58%
2013
$65.47
$108,550
$108,550
2023 Fort Bend County Appraisal District Tax Value
Market Land Value:
$30,400
Market Improvement Value:
$244,051
Total Market Value : $274,451
2023 Tax Rates
FORT BEND ISD:
0.9892 %
FT BEND CO GEN:
0.4265 %
FORT BEND DRNG:
0.0124 %
N MISSION GLEN MUD:
0.3900 %
WEST KEEGANS BAYOU IMP DIST:
0.0787 %
FT BEND CO ESD 5:
0.0862 %
Total Tax Rate : 1.9829 %