Sold Price Range: $160,001 - $185,000
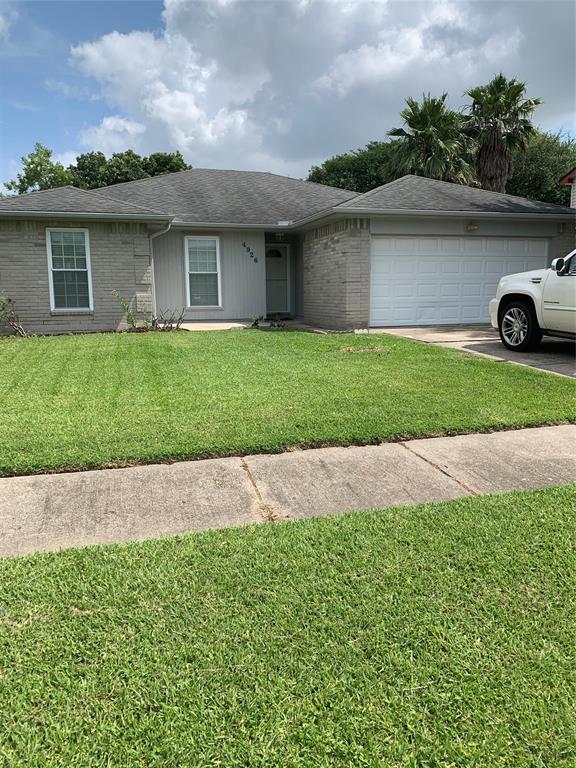
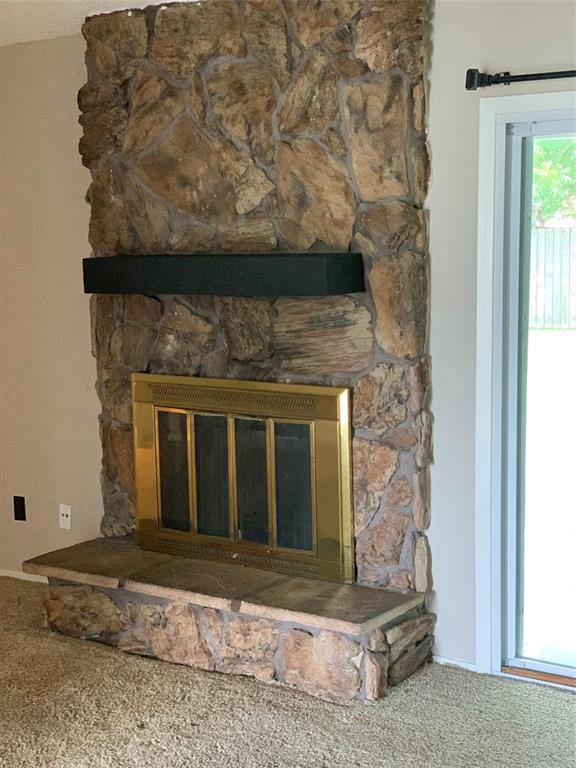
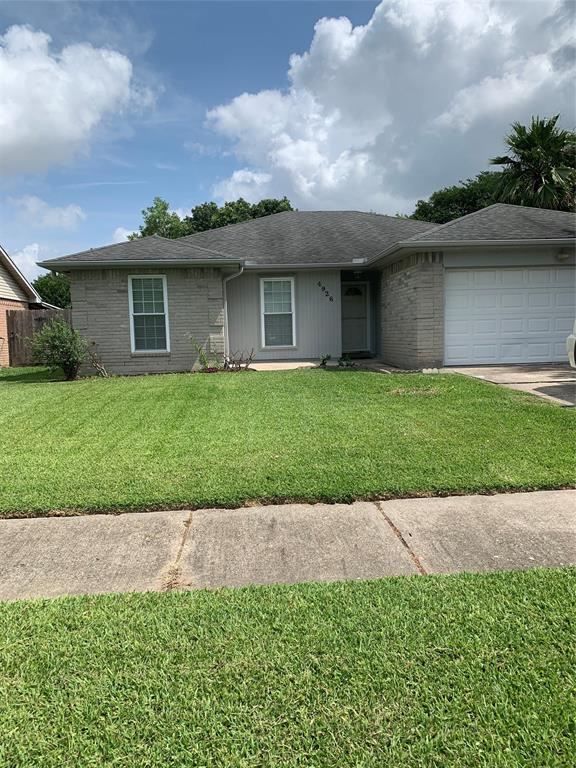
All electric, butane fireplace, split floor plan, closets galore, double shower handicap equipped with bench, 2 car garage, ceramic tile and carpet, freshly painted outside of house, fully fenced. Neat as a pin.
Premium Content
Get full access to Premium Content
Sold Price for nearby listings,
Property History Reports and more.
Sign Up or
Log In Now
General Description
Sold Price Range:
$160,001 - $185,000
Address:
4926 Glenvalley Drive
Legal Description:
LT 25 BLK 18 GLEN MEADOWS SEC 2
Property Type:
Single-Family
Year Built:
1980 / Appraisal District
Building Sqft.:
1,273 118(m²) /Appraisal District
Lot Size:
7,020 Sqft. 652(m²) /Appraisal District
Ready to sell your home?
If you are considering selling your home, you may find out how now. Request your home selling analysis featuring Recently Sold, Market Analysis, Home Valuations and Market Update.
GET STARTED
Room Dimension
Primary Bedroom:
15x16, 1st
Interior Features
Number Of Dinning Area:
Den
Fireplace:
1/Gaslog Fireplace
Bedroom Description:
All Bedrooms Down
Bathroom Description:
Disabled Access, Shower Only
Cooling:
Central Electric
Connections:
Electric Dryer Connections, Washer Connections
Range:
Electric Range, Freestanding Range
Oven:
Electric Oven, Freestanding Oven
Exterior Features
Exterior Type:
Brick & Wood
Lot Description:
Subdivision Lot
Water Sewer:
Public Sewer, Public Water
Unit Location:
Subdivision Lot
Exterior:
Back Yard Fenced
Assigned School Information
School information is computer generated and may not be accurate or current. Buyer must independently verify and confirm enrollment. Please contact the school district to determine the schools to which this property is zoned.
Listing Broker: Main Properties
Email Listing Broker
Selling Broker: Keller Williams Realty Clear Lake / NASA
Last updated as of: 07/17/2024
Property Tax
Market Value Per Appraisal District
Cost/Sqft based on Market Value
Tax Year
Cost/sqft
Market Value
Change
Tax Assessment
Change
2023
$170.50
$217,047
15.43% $206,829
10.00%
2022
$147.70
$188,027
8.46% $188,027
8.46%
2021
$136.19
$173,366
8.46% $173,366
8.46%
2020
$125.56
$159,841
8.89% $159,841
8.89%
2019
$115.31
$146,790
3.56% $146,790
3.56%
2018
$111.35
$141,744
0.00% $141,744
7.83%
2017
$111.35
$141,744
18.61% $131,455
10.00%
2016
$93.88
$119,505
4.29% $119,505
4.29%
2015
$90.02
$114,591
6.25% $114,591
6.25%
2014
$84.72
$107,847
0.00% $107,847
0.00%
2013
$84.72
$107,847
0.00% $107,847
0.00%
2012
$84.72
$107,847
$107,847
2023 Harris County Appraisal District Tax Value
Market Land Value:
$59,301
Market Improvement Value:
$157,746
Total Market Value : $217,047
2023 Tax Rates
LA PORTE ISD:
0.9739 %
HARRIS COUNTY:
0.3501 %
HC FLOOD CONTROL DIST:
0.0311 %
PORT OF HOUSTON AUTHORITY:
0.0057 %
HC HOSPITAL DIST:
0.1434 %
HC DEPARTMENT OF EDUCATION:
0.0048 %
SAN JACINTO COM COL D:
0.1462 %
LA PORTE CITY OF:
0.7100 %
Total Tax Rate : 2.3652 %