Sold Price Range: $140,001 - $160,000
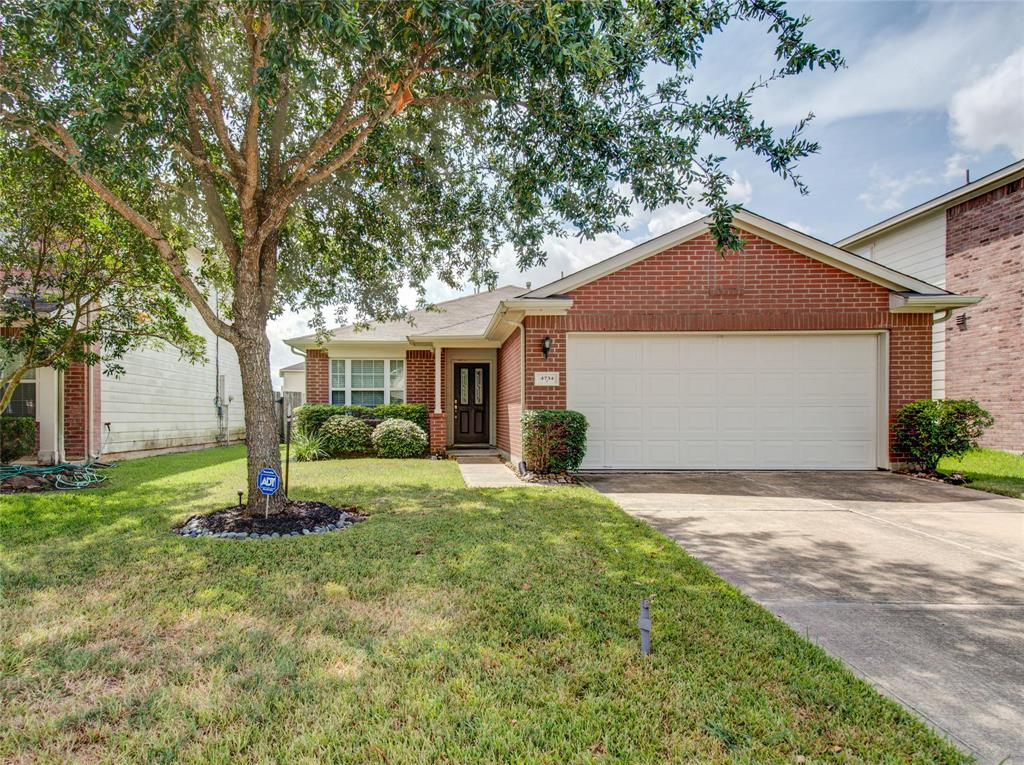
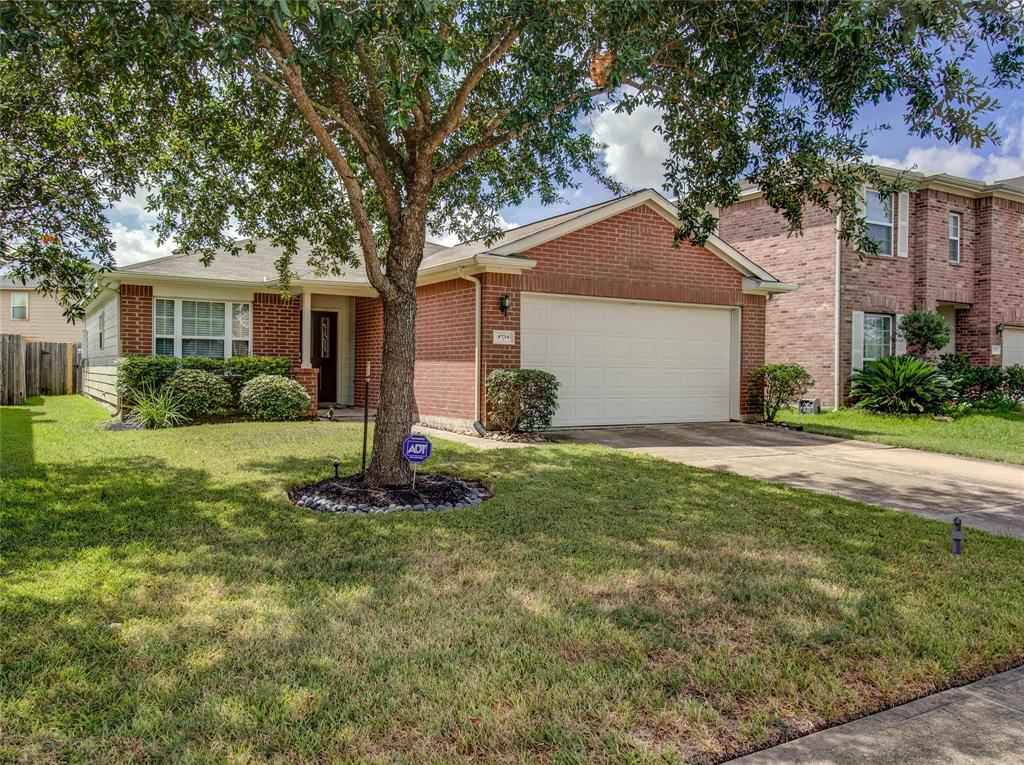
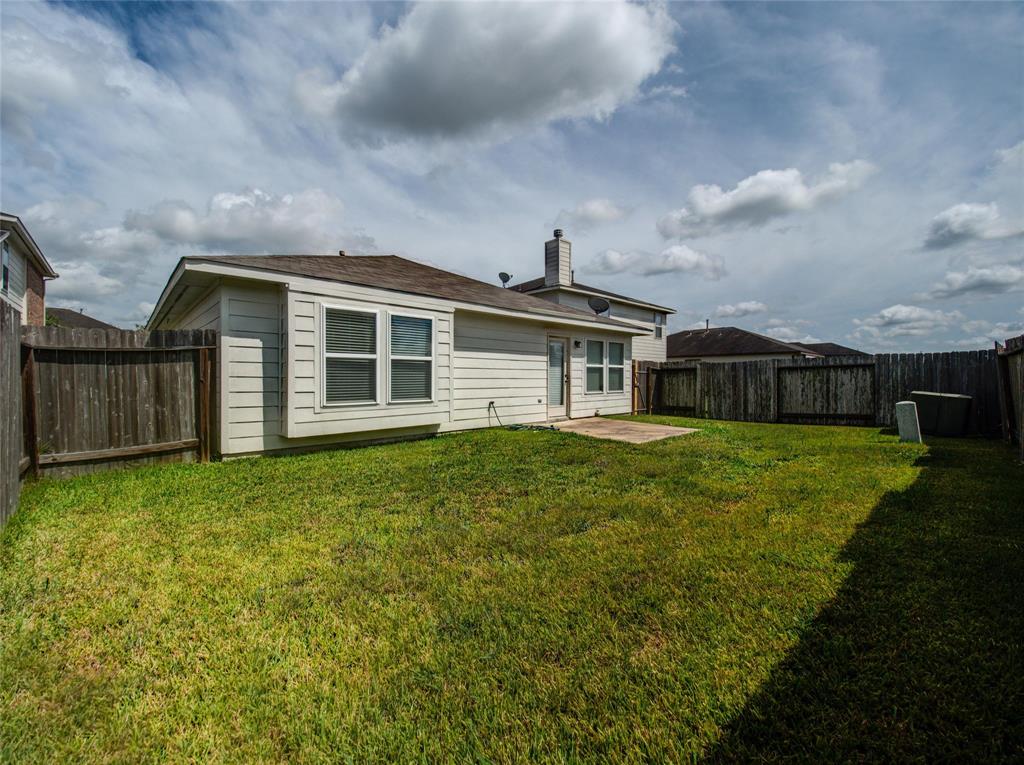
Great One Story in Andover Farms. 3/2/2 open bright floor plan with kitchen with island overlooking the family room, master bedroom with walk in closet space, bathroom room with double sinks, separate shower and tub. Great back yard for the kids to go play. Welcome Home!!!!
Premium Content
Get full access to Premium Content
Sold Price for nearby listings,
Property History Reports and more.
Sign Up or
Log In Now
General Description
Sold Price Range:
$140,001 - $160,000
Address:
4734 Montclair Hill Lane
Legal Description:
ANDOVER FARMS SEC 4, BLOCK 2, LOT 23
Property Type:
Single-Family
Year Built:
2006 / Appraisal District
Building Sqft.:
1,550 144(m²) /Appraisal District
Lot Size:
5,060 Sqft. 470(m²) /Appraisal District
Maintenance Fee:
$ 500 / Annually
Ready to sell your home?
If you are considering selling your home, you may find out how now. Request your home selling analysis featuring Recently Sold, Market Analysis, Home Valuations and Market Update.
GET STARTED
Room Dimension
Primary Bedroom:
16x13, 1st
Interior Features
Number Of Dinning Area:
Family Room
Bathroom Description:
Double Sinks, Primary Bath + Separate Shower
Room Description:
Family Room
Kitchen Description:
Island w/o Cooktop
Bedroom Description:
All Bedrooms Down, Primary Bed - 1st Floor, Walk-In Closet
Cooling:
Central Electric
Connections:
Electric Dryer Connections, Washer Connections
Energy Feature:
Attic Fan, Attic Vents
Exterior Features
Exterior Type:
Brick & Wood, Cement Board
Lot Description:
Subdivision Lot
Water Sewer:
Public Sewer, Public Water
Unit Location:
Subdivision Lot
Assigned School Information
School information is computer generated and may not be accurate or current. Buyer must independently verify and confirm enrollment. Please contact the school district to determine the schools to which this property is zoned.
Listing Broker: Keller Williams Realty -SW
Email Listing Broker
Selling Broker: Keller Williams Realty Southwest
Last updated as of: 06/30/2024
Property Tax
Market Value Per Appraisal District
Cost/Sqft based on Market Value
Tax Year
Cost/sqft
Market Value
Change
Tax Assessment
Change
2023
$148.67
$230,434
13.51% $230,434
13.51%
2022
$130.97
$203,010
25.31% $203,010
25.31%
2021
$104.52
$162,000
3.90% $162,000
3.90%
2020
$100.59
$155,920
8.38% $155,920
8.38%
2019
$92.81
$143,860
3.81% $143,860
3.81%
2018
$89.41
$138,580
2.93% $138,580
2.93%
2017
$86.86
$134,640
2.85% $134,640
2.85%
2016
$84.46
$130,910
10.27% $130,910
10.27%
2015
$76.59
$118,720
35.40% $118,720
35.40%
2014
$56.57
$87,680
2.73% $87,680
2.73%
2013
$55.06
$85,350
$85,350
2023 Fort Bend County Appraisal District Tax Value
Market Land Value:
$29,700
Market Improvement Value:
$200,734
Total Market Value : $230,434
2023 Tax Rates
FORT BEND ISD:
0.9892 %
FT BEND CO GEN:
0.4265 %
FORT BEND DRNG:
0.0124 %
FT BEND MUD 23:
0.6000 %
FT BEND CO ESD 7:
0.1000 %
Total Tax Rate : 2.1281 %