Sold Price Range: $370,001 - $420,000
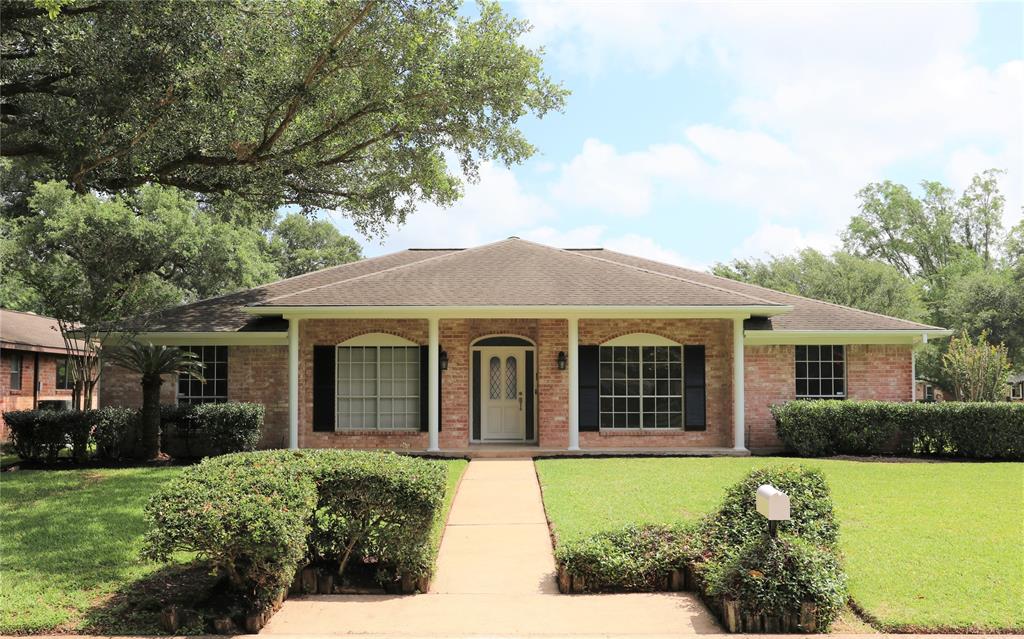
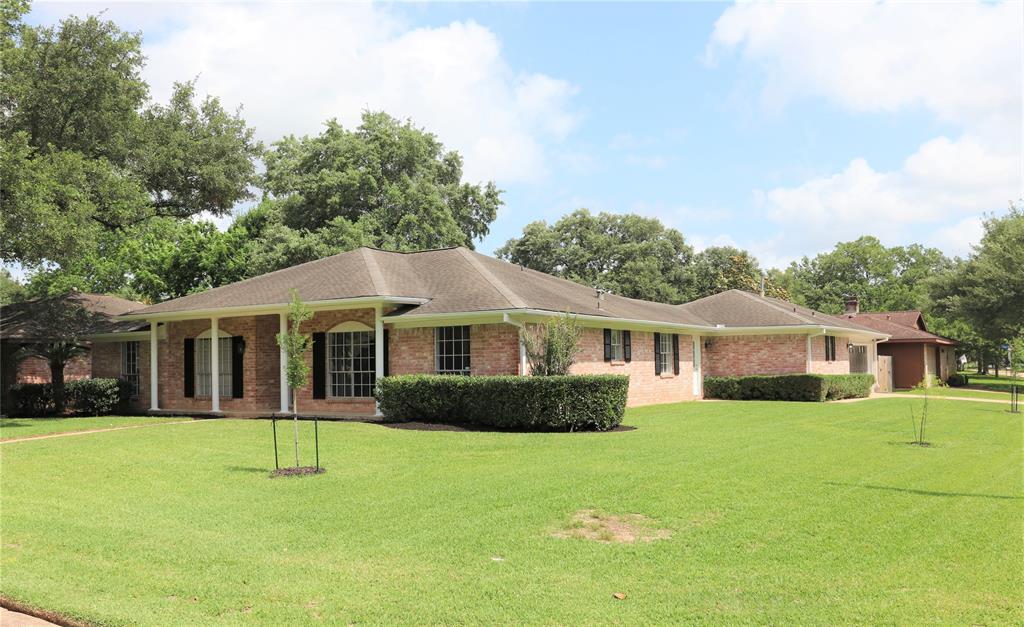
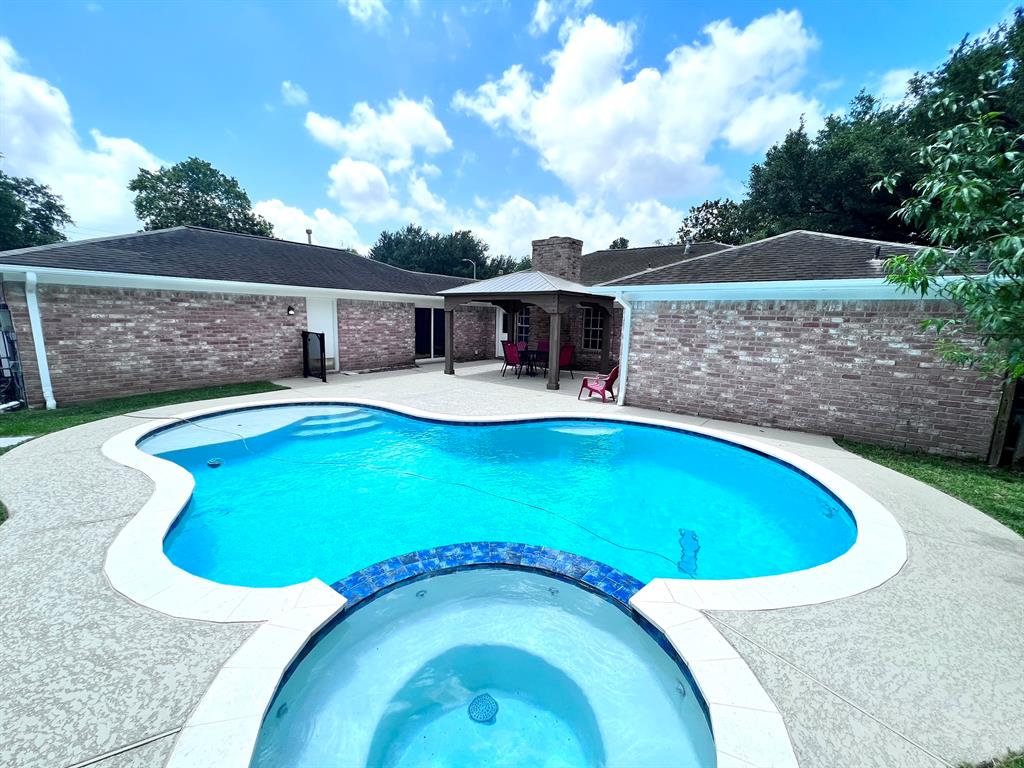
New Price, completely remodeled home in Missouri City, This 5 bedroom 3 full bath features engineer wood floors, quartz in all counters, a pool built in 2022, 2 separate laundry rooms, 2 separate master bedrooms with their own full bath. Garage has a room that can be used for storage or a small library or study room. This property has it all, schedule your appointments for a private tour.
Premium Content
Get full access to Premium Content
Sold Price for nearby listings,
Property History Reports and more.
Sign Up or
Log In Now
General Description
Sold Price Range:
$370,001 - $420,000
Address:
3302 Rolling Green Ln
Legal Description:
QUAIL VALLEY THUNDERBIRD W SEC 1, BLOCK 4, LOT 19
Property Type:
Single-Family
Garage(s):
2 / Attached/Detached
Year Built:
1975 / Appraisal District
Building Sqft.:
2,785 259(m²) /Seller
Lot Size:
10,790 Sqft. 1,002(m²) /Appraisal District
Maintenance Fee:
$ 435 / Annually
Ready to sell your home?
If you are considering selling your home, you may find out how now. Request your home selling analysis featuring Recently Sold, Market Analysis, Home Valuations and Market Update.
GET STARTED
Room Dimension
Primary Bedroom:
15X14, 1st
Interior Features
Bedroom Description:
All Bedrooms Down
Cooling:
Central Electric
Exterior Features
Private Pool Desc:
In Ground
Lot Description:
Cleared, Corner
Water Sewer:
Water District
Assigned School Information
School information is computer generated and may not be accurate or current. Buyer must independently verify and confirm enrollment. Please contact the school district to determine the schools to which this property is zoned.
Listing Broker: Sierra Vista Realty LLC
Email Listing Broker
Selling Broker: Keller Williams Realty Metropolitan
Last updated as of: 06/30/2024
Property Tax
Market Value Per Appraisal District
Cost/Sqft based on Market Value
Tax Year
Cost/sqft
Market Value
Change
Tax Assessment
Change
2023
$165.35
$460,492
16.63% $418,931
6.10%
2022
$141.77
$394,830
38.75% $394,830
38.75%
2021
$102.18
$284,560
2.29% $284,560
2.29%
2020
$99.89
$278,200
5.53% $278,200
5.53%
2019
$94.65
$263,610
8.81% $263,610
8.81%
2018
$86.99
$242,270
-3.58% $242,270
-3.11%
2017
$90.22
$251,270
-0.11% $250,050
10.00%
2016
$90.32
$251,550
17.61% $227,320
10.00%
2015
$76.80
$213,880
13.85% $206,650
10.00%
2014
$67.45
$187,860
6.65% $187,860
6.65%
2013
$63.25
$176,150
$176,150
2023 Fort Bend County Appraisal District Tax Value
Market Land Value:
$33,600
Market Improvement Value:
$426,892
Total Market Value : $460,492
2023 Tax Rates
FORT BEND ISD:
0.9892 %
HCC MISSOURI CITY:
0.0922 %
CITY OF MISSOURI CITY:
0.5708 %
FT BEND CO GEN:
0.4265 %
FORT BEND DRNG:
0.0124 %
THUNDERBIRD MUD:
0.1331 %
Total Tax Rate : 2.2243 %