Sold Price Range: $215,001 - $250,000
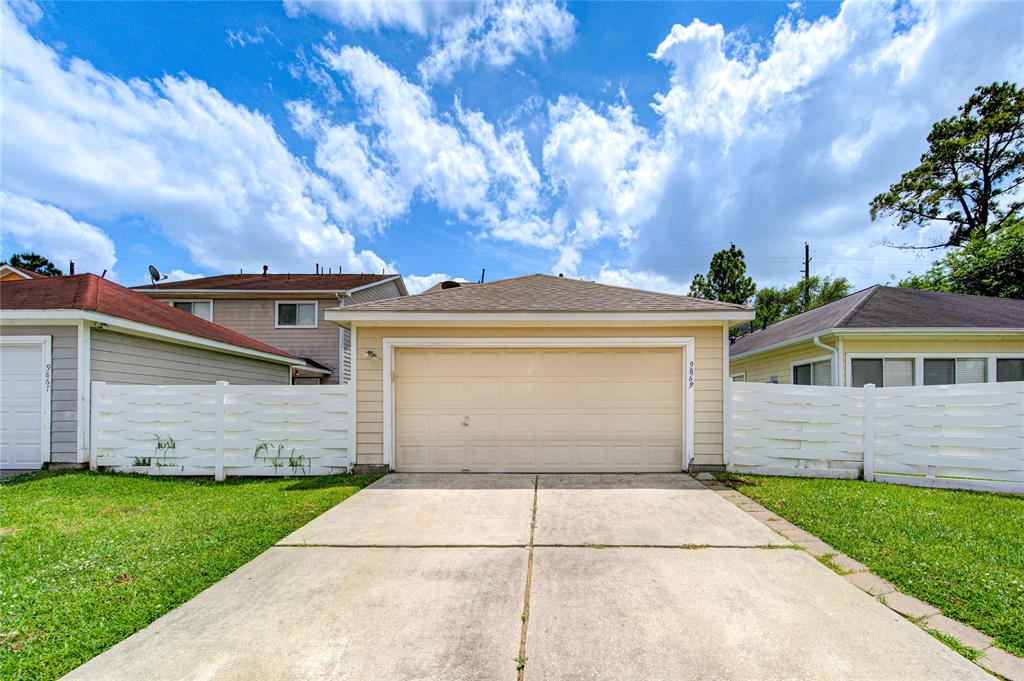
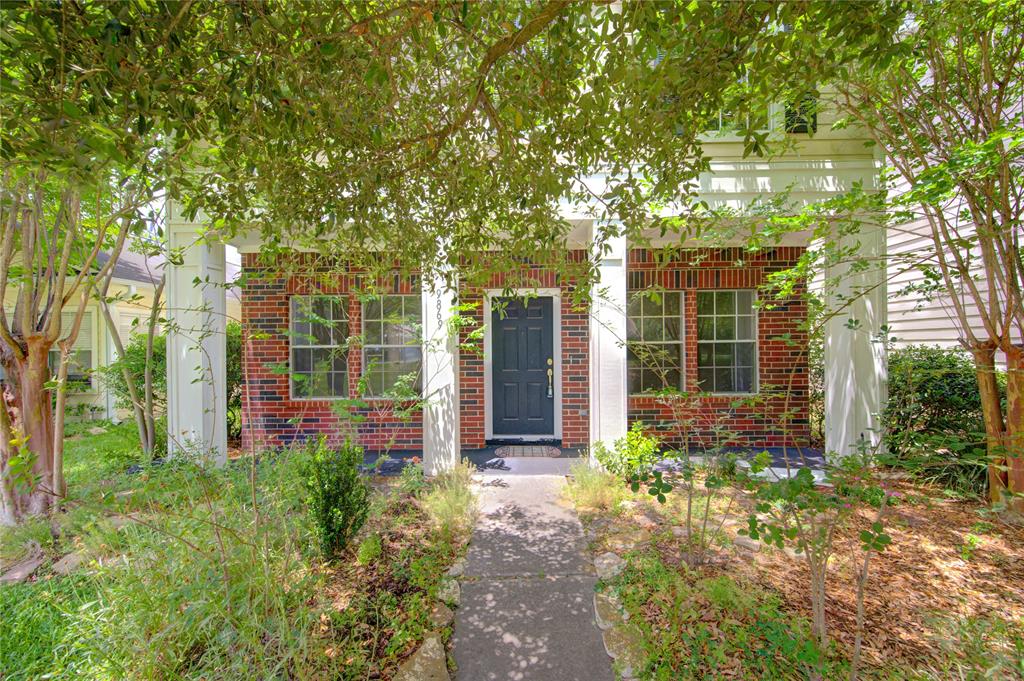
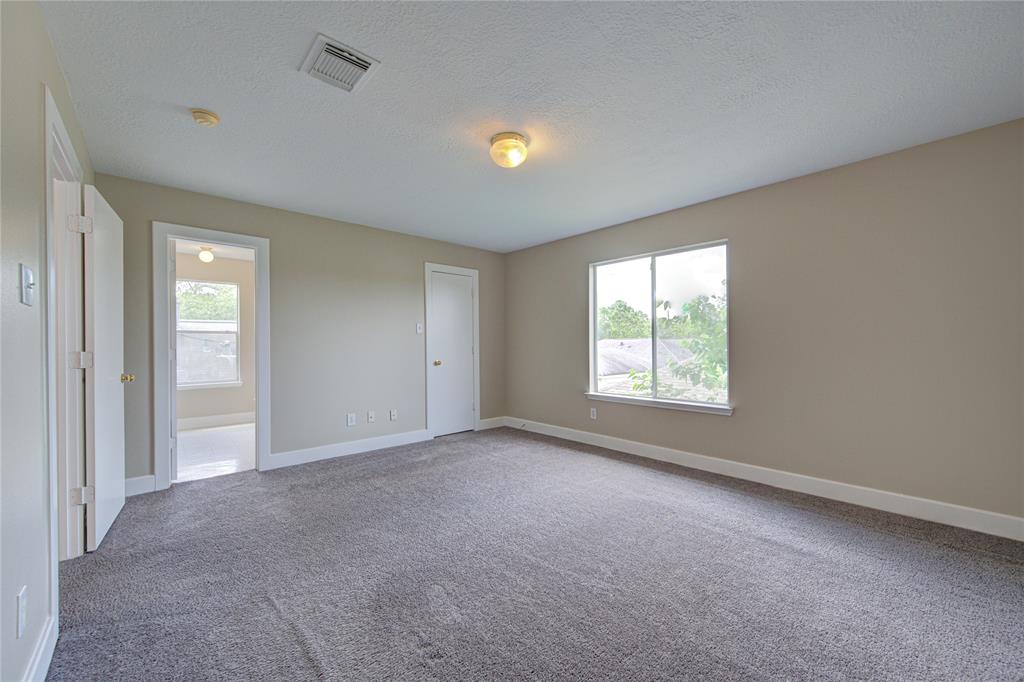
Great location with gated community, perfect floor plan. A spacious and wood floor of family room downstairs featuring an open concept kitchen and dining room area. Game room upstairs could be the 4th bedroom and half bathroom is very continence for your gusts. Detached garage, low tax rate, low HOA fee!!!
Premium Content
Get full access to Premium Content
Sold Price for nearby listings,
Property History Reports and more.
Sign Up or
Log In Now
General Description
Sold Price Range:
$215,001 - $250,000
Address:
9869 Farrell Drive
Legal Description:
LT 49 BLK 2 PARKSIDE AT PERRY SEC 1
Property Type:
Single-Family
Baths:
2 Full & 1 Half Bath(s)
Year Built:
2000 / Appraisal District
Building Sqft.:
1,820 169(m²) /Appraisal District
Lot Size:
6,057 Sqft. 563(m²) /Appraisal District
Maintenance Fee:
$ 695 / Annually
Ready to sell your home?
If you are considering selling your home, you may find out how now. Request your home selling analysis featuring Recently Sold, Market Analysis, Home Valuations and Market Update.
GET STARTED
Interior Features
Fireplace:
1/Gaslog Fireplace
Bathroom Description:
Primary Bath: Double Sinks, Primary Bath: Separate Shower
Bedroom Description:
All Bedrooms Up
Room Description:
1 Living Area, Breakfast Room, Formal Dining, Gameroom Up, Utility Room in House
Cooling:
Central Electric
Range:
Freestanding Range, Gas Range
Exterior Features
Exterior Type:
Cement Board, Wood
Lot Description:
Cul-De-Sac, Subdivision Lot
Water Sewer:
Public Sewer, Public Water
Unit Location:
Cul-De-Sac, Subdivision Lot
Exterior:
Back Yard Fenced
Assigned School Information
School information is computer generated and may not be accurate or current. Buyer must independently verify and confirm enrollment. Please contact the school district to determine the schools to which this property is zoned.
Listing Broker: Glad Realty LLC
Email Listing Broker
Selling Broker: Realty Associates
Last updated as of: 07/22/2024
Property Tax
Market Value Per Appraisal District
Cost/Sqft based on Market Value
Tax Year
Cost/sqft
Market Value
Change
Tax Assessment
Change
2023
$128.24
$233,388
10.95% $233,388
10.95%
2022
$115.58
$210,359
17.86% $210,359
17.86%
2021
$98.07
$178,486
6.73% $178,486
6.73%
2020
$91.88
$167,225
11.81% $167,225
11.81%
2019
$82.18
$149,565
8.27% $149,565
8.27%
2018
$75.90
$138,141
0.00% $138,141
0.00%
2017
$75.90
$138,141
3.34% $138,141
3.34%
2016
$73.45
$133,672
3.05% $133,672
3.05%
2015
$71.28
$129,721
11.01% $129,721
11.01%
2014
$64.20
$116,850
18.69% $116,850
18.69%
2013
$54.10
$98,453
0.00% $98,453
0.00%
2012
$54.10
$98,453
$98,453
2023 Harris County Appraisal District Tax Value
Market Land Value:
$47,134
Market Improvement Value:
$186,254
Total Market Value : $233,388
2023 Tax Rates
CYPRESS-FAIRBANKS ISD:
1.0811 %
HARRIS COUNTY:
0.3501 %
HC FLOOD CONTROL DIST:
0.0311 %
PORT OF HOUSTON AUTHORITY:
0.0057 %
HC HOSPITAL DIST:
0.1434 %
HC DEPARTMENT OF EDUCATION:
0.0048 %
LONE STAR COLLEGE SYS:
0.1076 %
HC EMERG SRV DIST 13:
0.0919 %
HC EMERG SRV DIST 11:
0.0302 %
MILLS ROAD MUD:
0.4800 %
Total Tax Rate : 2.3258 %