Sold Price Range: $185,001 - $215,000
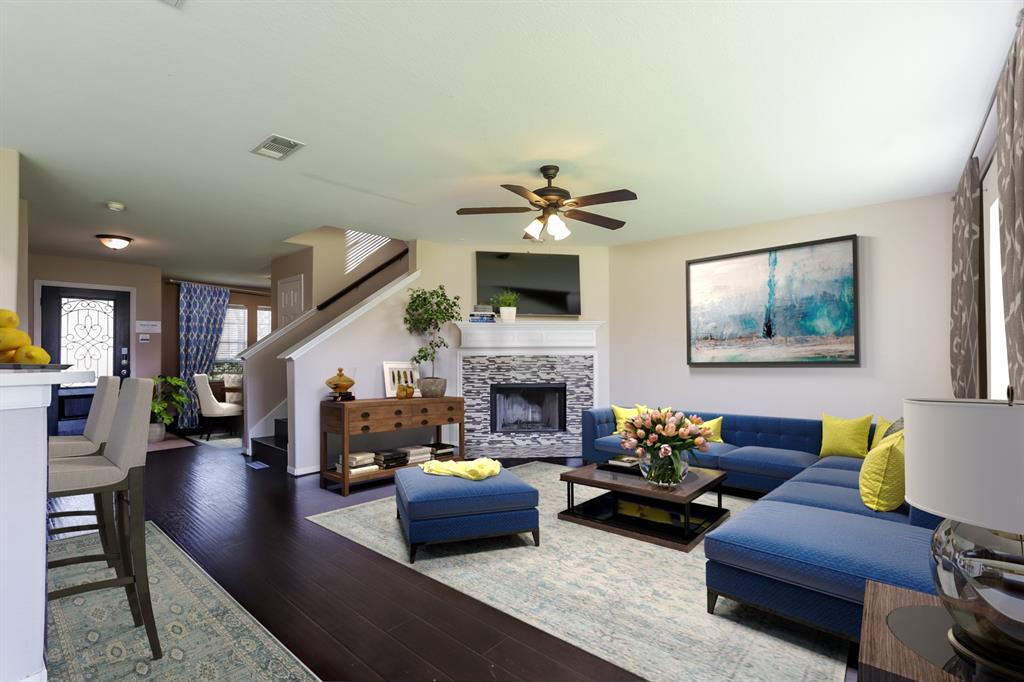
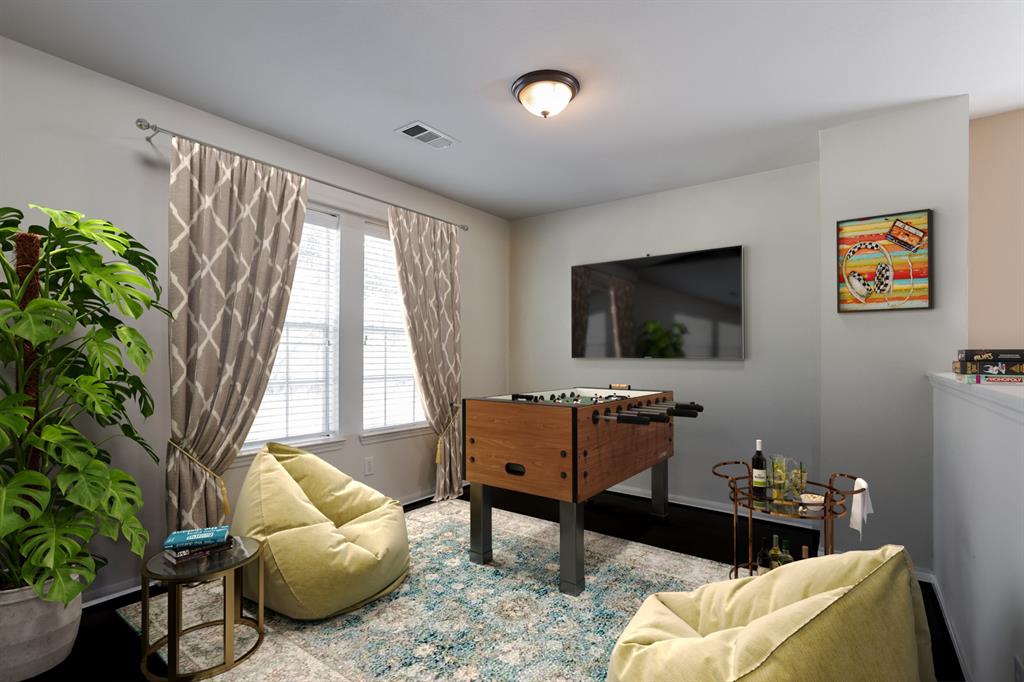
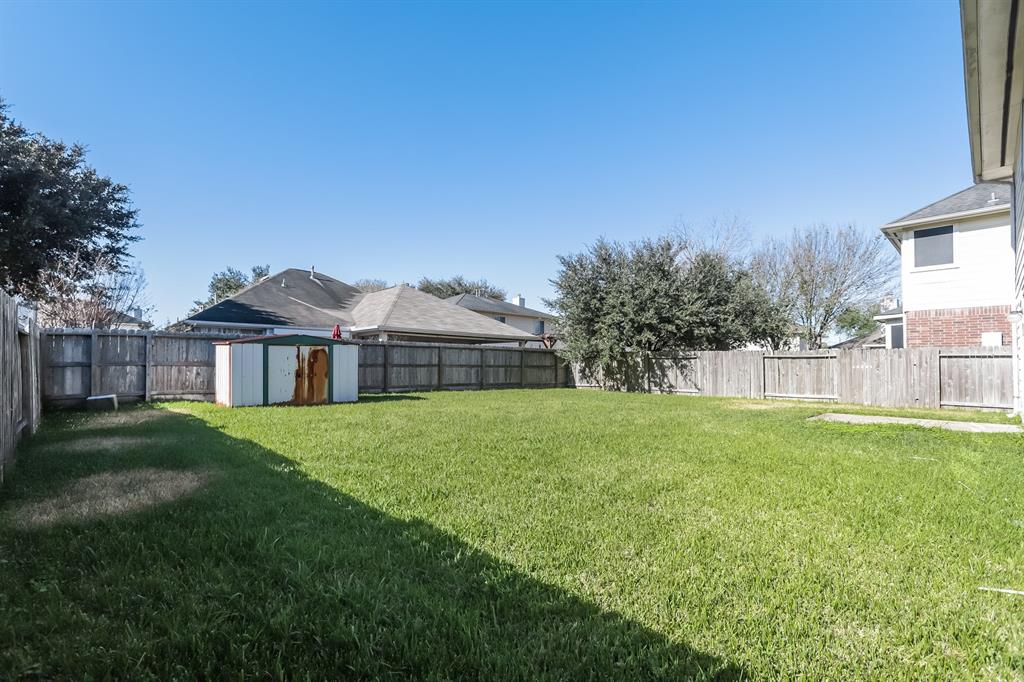
Built in 2000, this Sugar Land two-story home offers gas heating, stainless steel appliances, Corian kitchen countertops, a walk-in master closet, a loft, and a two-car garage. "This home has been virtually staged to illustrate its potential! Thanks for viewing!”
Premium Content
Get full access to Premium Content
Sold Price for nearby listings,
Property History Reports and more.
Sign Up or
Log In Now
General Description
Sold Price Range:
$185,001 - $215,000
Address:
17234 Maple Hollow Drive
Legal Description:
STRATFORD PARK VILLAGE TWO, BLOCK 2, LOT 4
Property Type:
Single-Family
Baths:
2 Full & 1 Half Bath(s)
Year Built:
2000 / Appraisal District
Building Sqft.:
2,085 194(m²) /Appraisal District
Lot Size:
6,168 Sqft. 573(m²) /Appraisal District
Maintenance Fee:
$ 430 / Annually
Ready to sell your home?
If you are considering selling your home, you may find out how now. Request your home selling analysis featuring Recently Sold, Market Analysis, Home Valuations and Market Update.
GET STARTED
Room Dimension
Primary Bedroom:
20 x 19, 2nd
Interior Features
Cooling:
Central Electric
Interior:
Alarm System - Owned
Exterior Features
Exterior Type:
Brick Veneer, Other
Lot Description:
Subdivision Lot
Water Sewer:
Water District
Unit Location:
Subdivision Lot
Assigned School Information
School information is computer generated and may not be accurate or current. Buyer must independently verify and confirm enrollment. Please contact the school district to determine the schools to which this property is zoned.
Listing Broker: Opendoor Brokerage, LLC
Email Listing Broker
Selling Broker: REALM Real Estate Professionals - Sugar Land
Last updated as of: 07/16/2024
Property Tax
Market Value Per Appraisal District
Cost/Sqft based on Market Value
Tax Year
Cost/sqft
Market Value
Change
Tax Assessment
Change
2023
$144.00
$300,236
22.90% $300,236
22.90%
2022
$117.17
$244,290
18.59% $244,290
18.59%
2021
$98.80
$206,000
0.13% $206,000
0.13%
2020
$98.68
$205,740
4.24% $205,740
4.24%
2019
$94.67
$197,380
-3.27% $197,380
-3.27%
2018
$97.87
$204,060
0.93% $204,060
7.91%
2017
$96.97
$202,180
7.66% $189,100
10.00%
2016
$90.07
$187,800
5.94% $171,910
10.00%
2015
$85.02
$177,270
24.78% $156,280
10.00%
2014
$68.14
$142,070
6.11% $142,070
6.11%
2013
$64.22
$133,890
$133,890
2023 Fort Bend County Appraisal District Tax Value
Market Land Value:
$36,000
Market Improvement Value:
$264,236
Total Market Value : $300,236
2023 Tax Rates
FORT BEND ISD:
0.9892 %
FT BEND CO GEN:
0.4265 %
FORT BEND DRNG:
0.0124 %
FT BEND MUD 25:
0.8540 %
FT BEND CO ESD 5:
0.0862 %
Total Tax Rate : 2.3683 %