Sold Price Range: $250,001 - $285,000
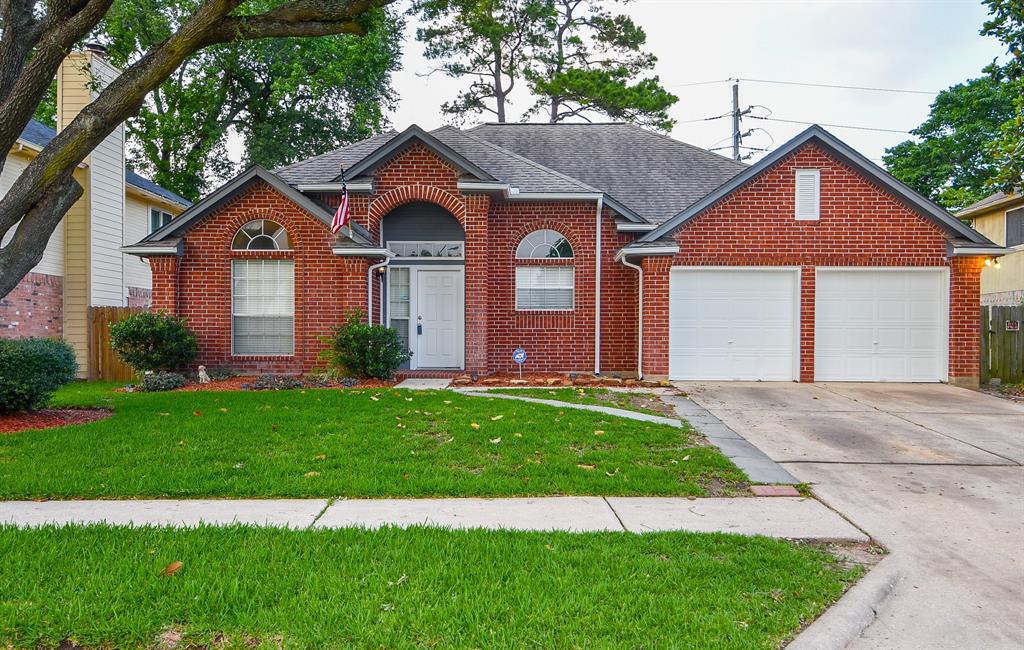
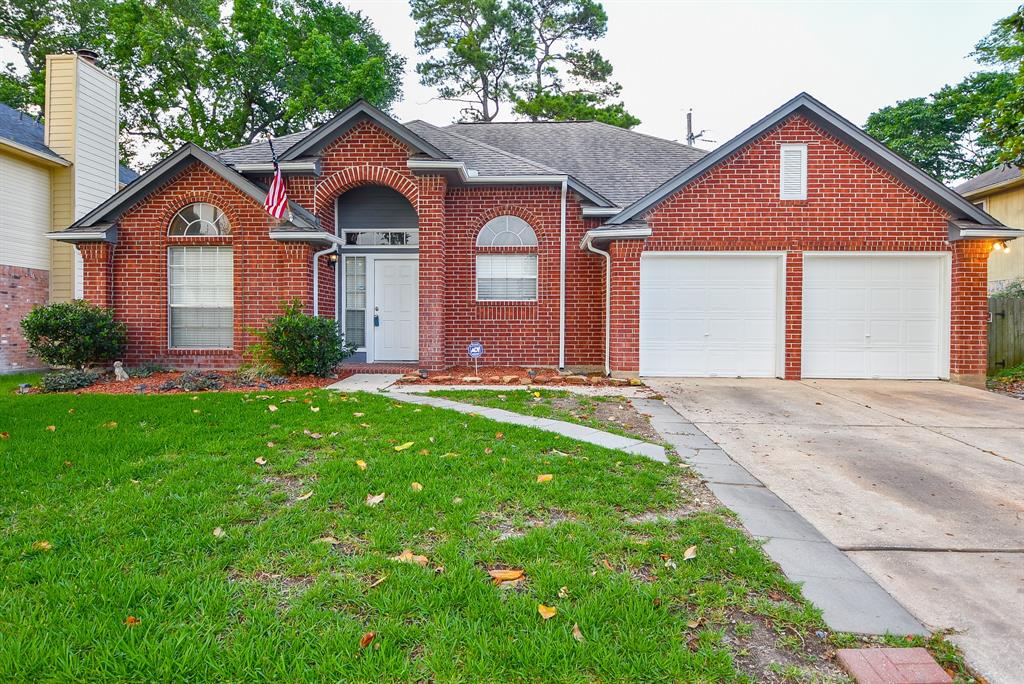
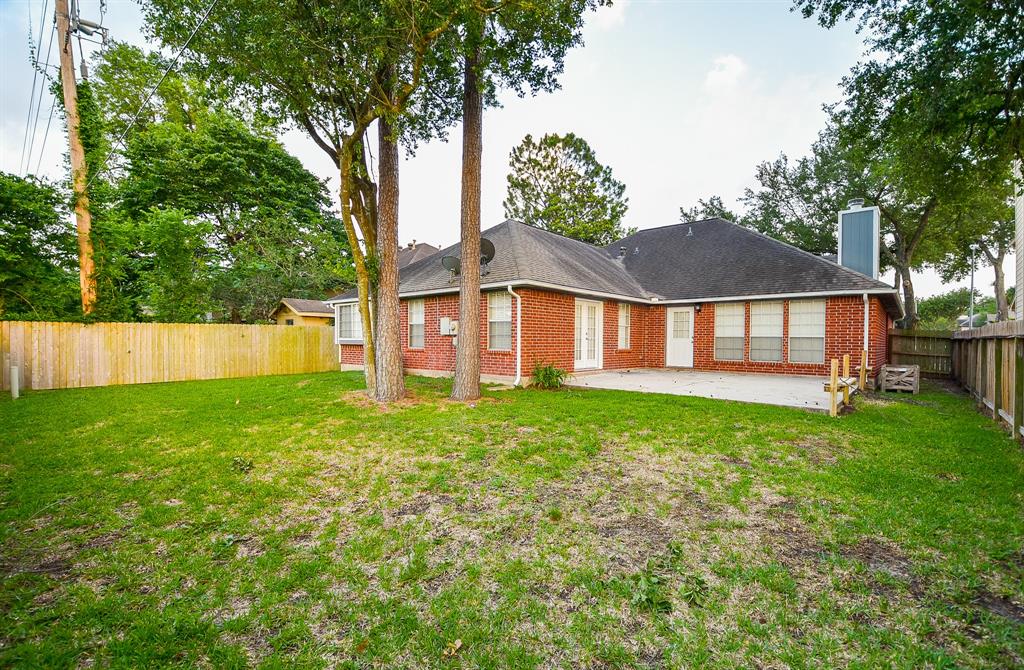
What a Beautiful 2 story 3Br, 2 and half Bathroom in Cranbrook subdivision. The owner renovated the entire house. The Roof is relatetiveley eight years old, brand new floors. Large backyard with no neighbors behind. The property is close major highways, hospitals, shopping and downtown. This is a must see property.
Premium Content
Get full access to Premium Content
Sold Price for nearby listings,
Property History Reports and more.
Sign Up or
Log In Now
General Description
Sold Price Range:
$250,001 - $285,000
Address:
1430 Rushworth Drive
Legal Description:
LT 11 BLK 1 CRANBROOK SEC 1
Property Type:
Single-Family
Baths:
2 Full & 1 Half Bath(s)
Year Built:
1991 / Appraisal District
Building Sqft.:
2,063 192(m²) /Appraisal District
Lot Size:
6,893 Sqft. 640(m²) /Appraisal District
Maintenance Fee:
$ 464 / Annually
Ready to sell your home?
If you are considering selling your home, you may find out how now. Request your home selling analysis featuring Recently Sold, Market Analysis, Home Valuations and Market Update.
GET STARTED
Room Dimension
Primary Bedroom:
15x15, 1st
Interior Features
Fireplace:
1/Freestanding
Bedroom Description:
All Bedrooms Down
Bathroom Description:
Primary Bath: Jetted Tub, Primary Bath: Separate Shower
Room Description:
1 Living Area, Den, Formal Dining
Cooling:
Central Electric
Connections:
Gas Dryer Connections
Energy Feature:
Ceiling Fans
Exterior Features
Water Sewer:
Public Water
Assigned School Information
School information is computer generated and may not be accurate or current. Buyer must independently verify and confirm enrollment. Please contact the school district to determine the schools to which this property is zoned.
Listing Broker: Realty Associates
Email Listing Broker
Selling Broker: Designed Realty Group
Last updated as of: 06/30/2024
Property Tax
Market Value Per Appraisal District
Cost/Sqft based on Market Value
Tax Year
Cost/sqft
Market Value
Change
Tax Assessment
Change
2023
$130.61
$269,458
24.78% $269,458
24.78%
2022
$104.68
$215,952
14.18% $215,952
14.18%
2021
$91.68
$189,139
15.03% $189,139
15.03%
2020
$79.70
$164,419
13.39% $164,419
13.39%
2019
$70.29
$145,000
29.46% $145,000
29.46%
2018
$54.29
$112,000
0.00% $112,000
0.00%
2017
$54.29
$112,000
6.67% $112,000
6.67%
2016
$50.90
$105,000
0.00% $105,000
0.00%
2015
$50.90
$105,000
-3.00% $105,000
-3.00%
2014
$52.47
$108,246
23.18% $108,246
23.18%
2013
$42.60
$87,877
11.57% $87,877
11.57%
2012
$38.18
$78,763
$78,763
2023 Harris County Appraisal District Tax Value
Market Land Value:
$44,297
Market Improvement Value:
$225,161
Total Market Value : $269,458
2023 Tax Rates
SPRING ISD:
1.1092 %
HARRIS COUNTY:
0.3501 %
HC FLOOD CONTROL DIST:
0.0311 %
PORT OF HOUSTON AUTHORITY:
0.0057 %
HC HOSPITAL DIST:
0.1434 %
HC DEPARTMENT OF EDUCATION:
0.0048 %
LONE STAR COLLEGE SYS:
0.1076 %
HC MUD 200:
0.5567 %
HC EMERG SRV DIST 17:
0.0839 %
HC EMERG SRV DIST 11:
0.0302 %
Total Tax Rate : 2.4226 %