Sold Price Range: $215,001 - $250,000
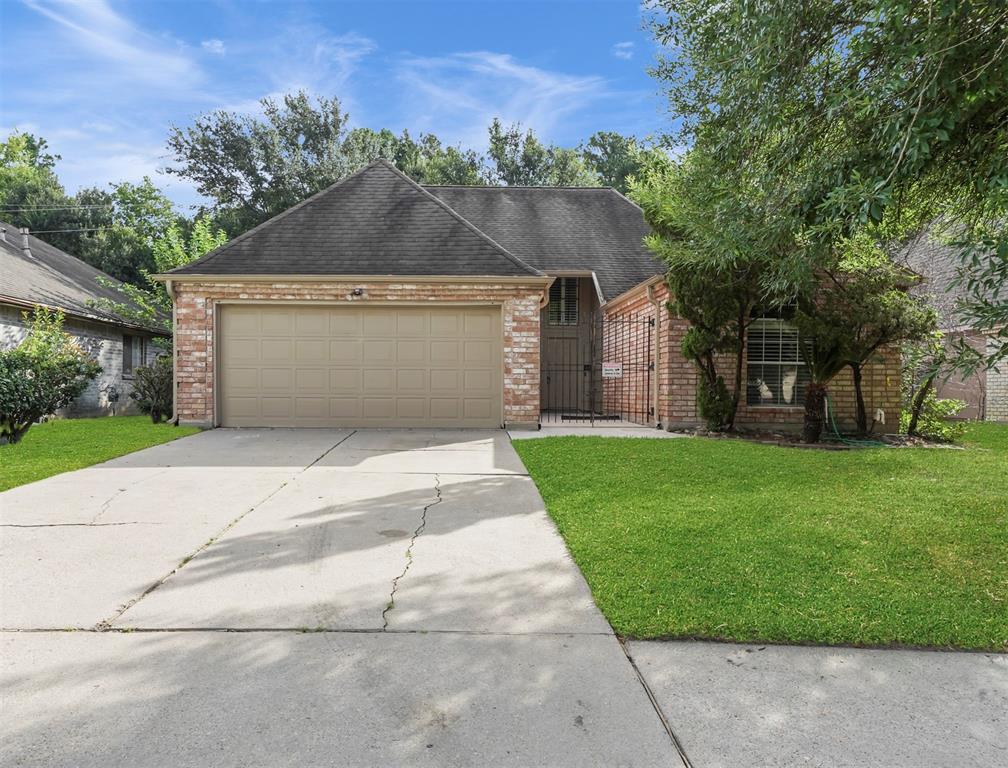
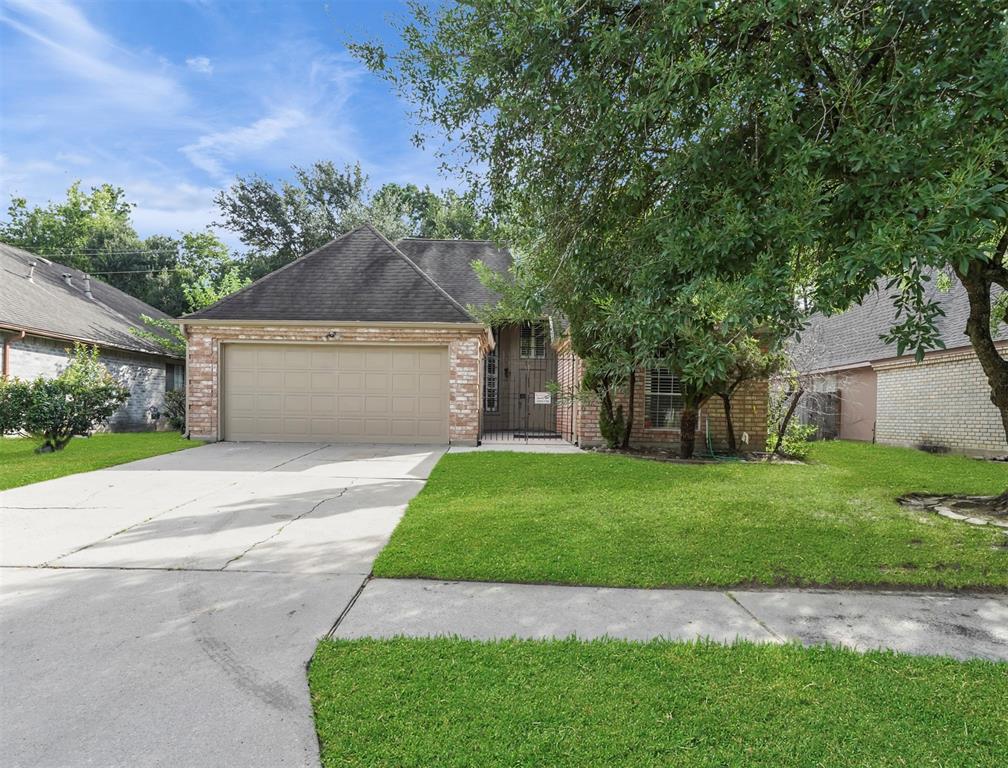
House has been recently updated. Fresh interior paint, new flooring, new dishwasher, foundation with warranty, new fixtures and so much more! Hurry won't last long.
Premium Content
Get full access to Premium Content
Sold Price for nearby listings,
Property History Reports and more.
Sign Up or
Log In Now
General Description
Sold Price Range:
$215,001 - $250,000
Address:
13918 Beckwith Drive
Legal Description:
LT 7 BLK 2 CRANBROOK SEC 1
Property Type:
Single-Family
Year Built:
1983 / Appraisal District
Building Sqft.:
2,196 204(m²) /Appraisal District
Lot Size:
6,148 Sqft. 571(m²) /Appraisal District
Maintenance Fee:
$ 425 / Annually
Ready to sell your home?
If you are considering selling your home, you may find out how now. Request your home selling analysis featuring Recently Sold, Market Analysis, Home Valuations and Market Update.
GET STARTED
Room Dimension
Family Room:
20 x 17, 1st
Primary Bedroom:
12 x 24, 1st
Interior Features
Fireplace:
2/Gas Connections
Bedroom Description:
All Bedrooms Down
Cooling:
Central Electric
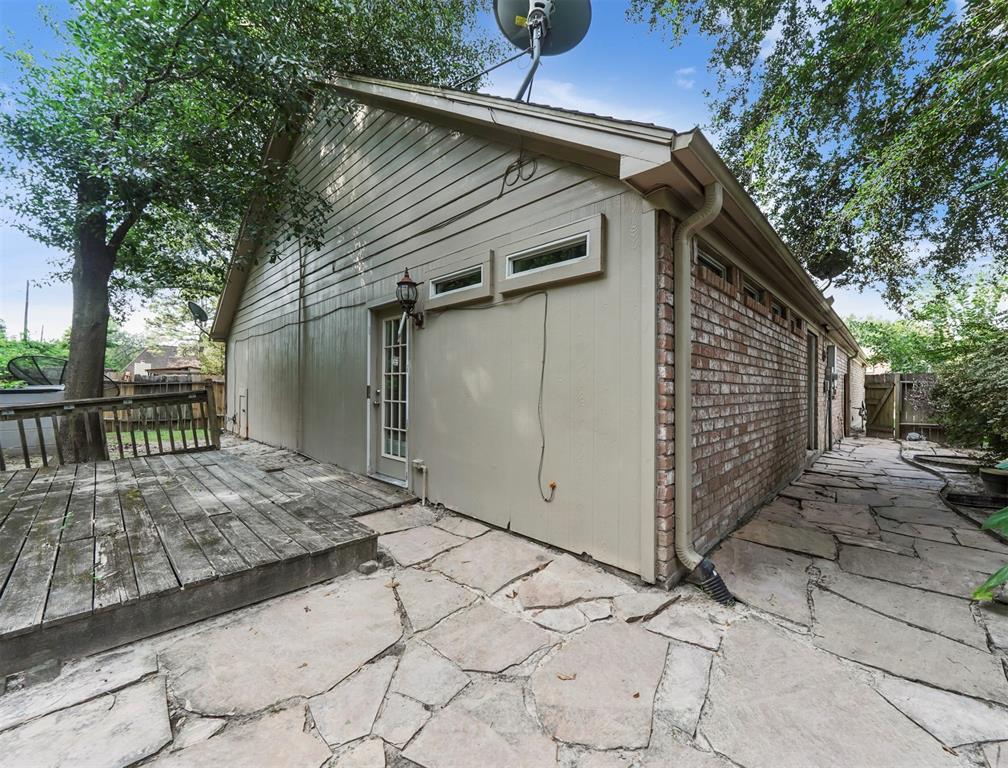
Exterior Features
Exterior Type:
Brick, Wood
Lot Description:
Subdivision Lot
Water Sewer:
Water District
Unit Location:
Subdivision Lot
Assigned School Information
School information is computer generated and may not be accurate or current. Buyer must independently verify and confirm enrollment. Please contact the school district to determine the schools to which this property is zoned.
Listing Broker: World Wide Realty
Email Listing Broker
Selling Broker: Realty Associates
Last updated as of: 06/30/2024
Property Tax
Market Value Per Appraisal District
Cost/Sqft based on Market Value
Tax Year
Cost/sqft
Market Value
Change
Tax Assessment
Change
2023
$125.39
$275,364
11.95% $270,565
10.00%
2022
$112.01
$245,969
29.00% $245,969
29.00%
2021
$86.83
$190,677
11.67% $190,677
11.67%
2020
$77.75
$170,747
4.75% $170,747
4.75%
2019
$74.23
$163,000
21.64% $163,000
21.64%
2018
$61.02
$134,000
0.00% $134,000
0.00%
2017
$61.02
$134,000
13.56% $134,000
13.56%
2016
$53.73
$118,000
0.00% $118,000
0.00%
2015
$53.73
$118,000
-2.33% $118,000
-2.33%
2014
$55.01
$120,809
27.98% $120,809
27.98%
2013
$42.99
$94,396
0.00% $94,396
0.00%
2012
$42.99
$94,396
$94,396
2023 Harris County Appraisal District Tax Value
Market Land Value:
$43,682
Market Improvement Value:
$231,682
Total Market Value : $275,364
2023 Tax Rates
SPRING ISD:
1.1092 %
HARRIS COUNTY:
0.3501 %
HC FLOOD CONTROL DIST:
0.0311 %
PORT OF HOUSTON AUTHORITY:
0.0057 %
HC HOSPITAL DIST:
0.1434 %
HC DEPARTMENT OF EDUCATION:
0.0048 %
LONE STAR COLLEGE SYS:
0.1076 %
HC MUD 200:
0.5567 %
HC EMERG SRV DIST 17:
0.0839 %
HC EMERG SRV DIST 11:
0.0302 %
Total Tax Rate : 2.4226 %