Sold Price Range: $250,001 - $285,000
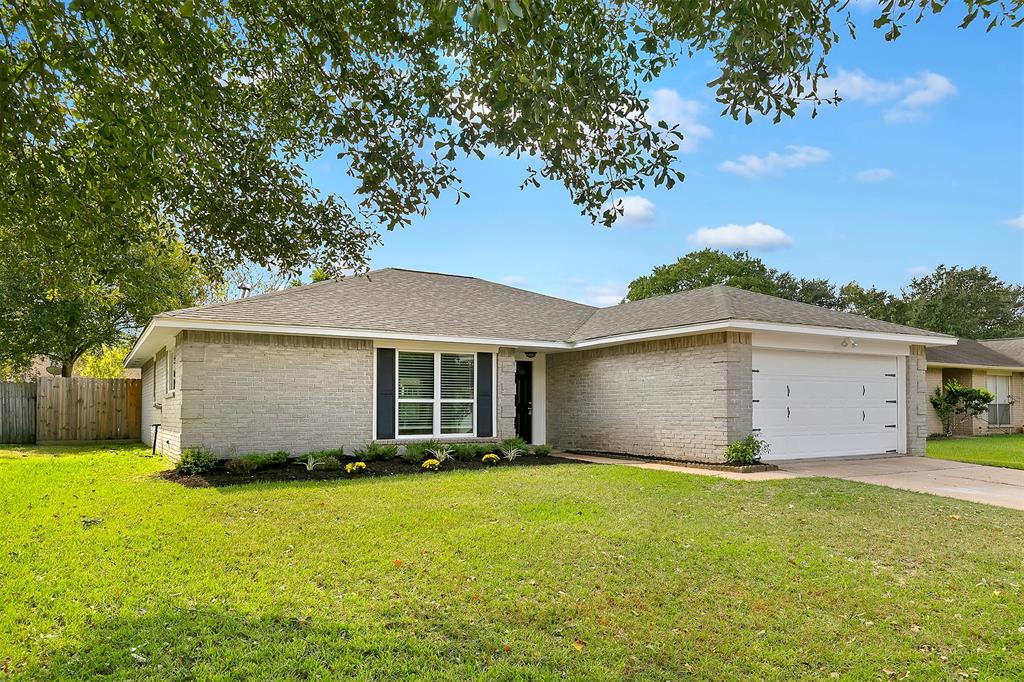
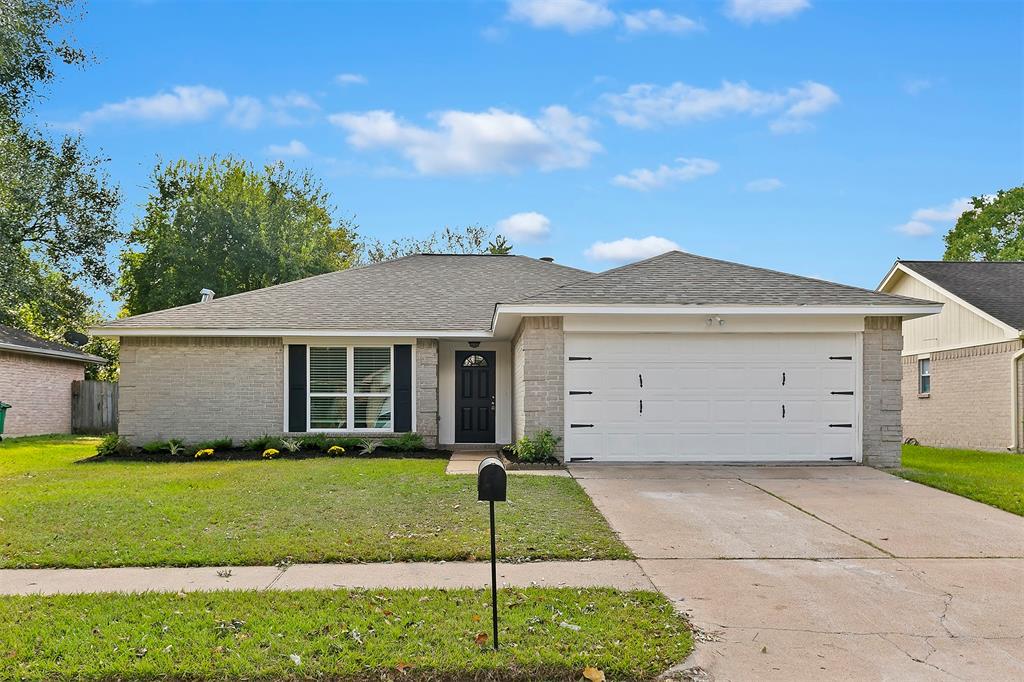
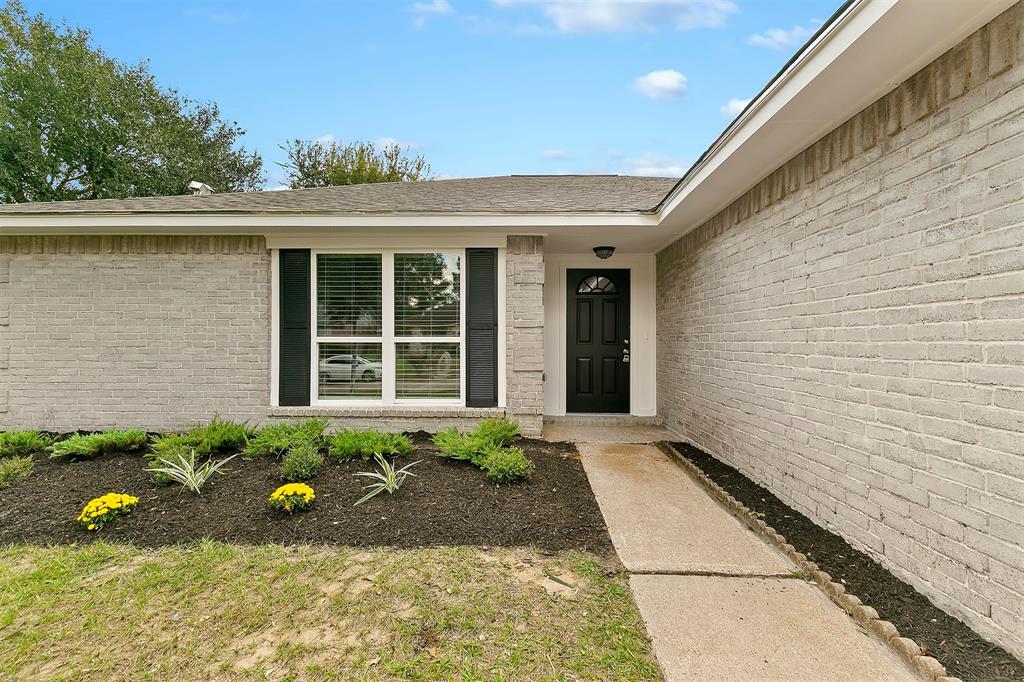
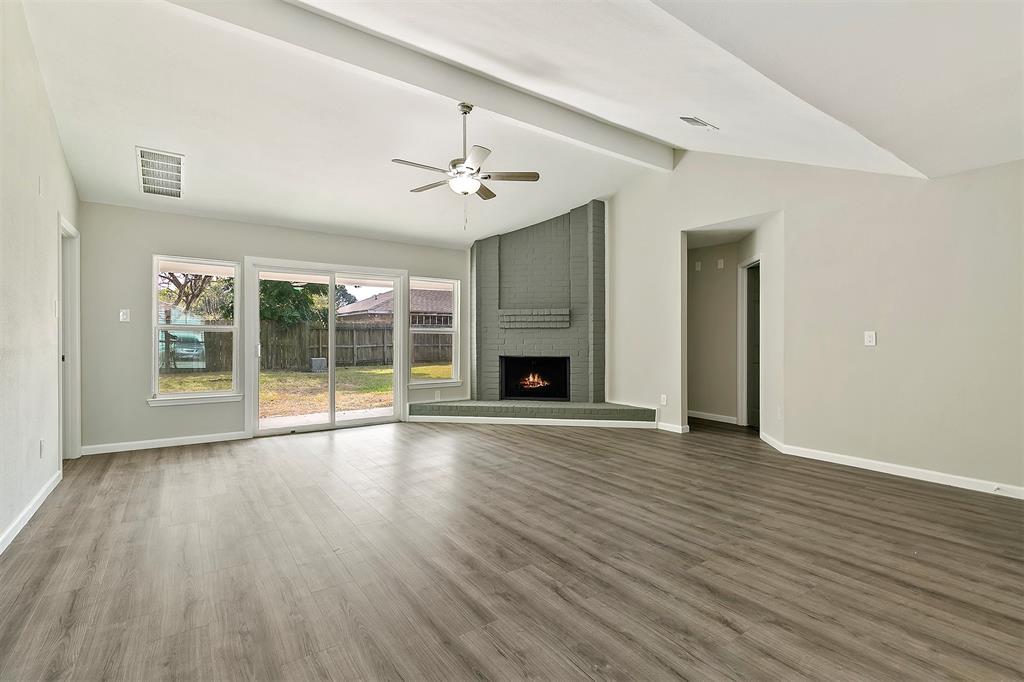
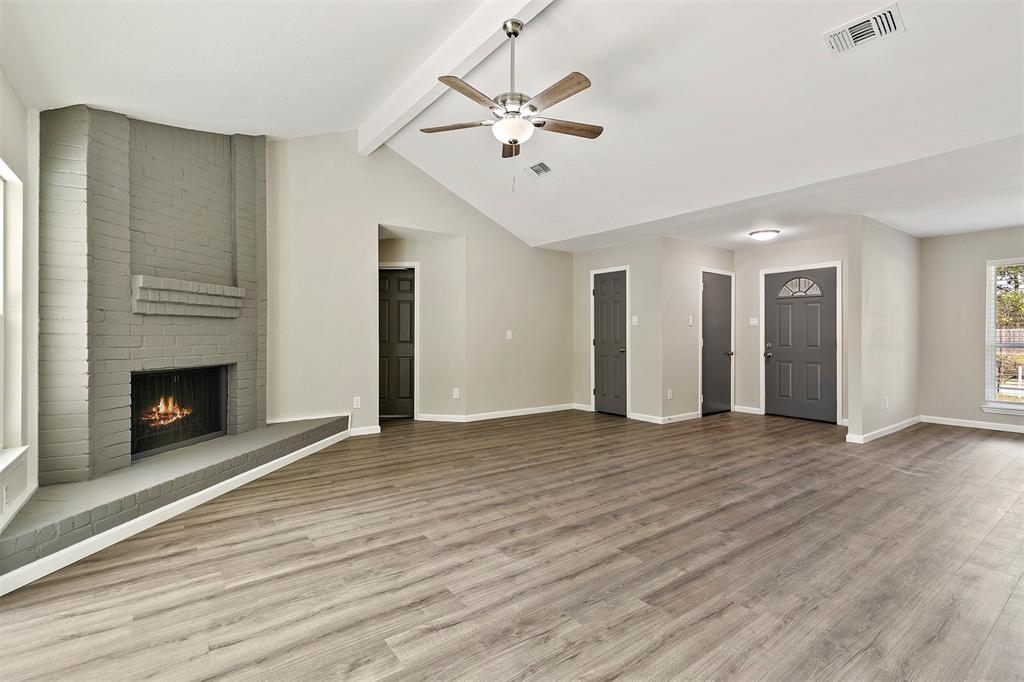
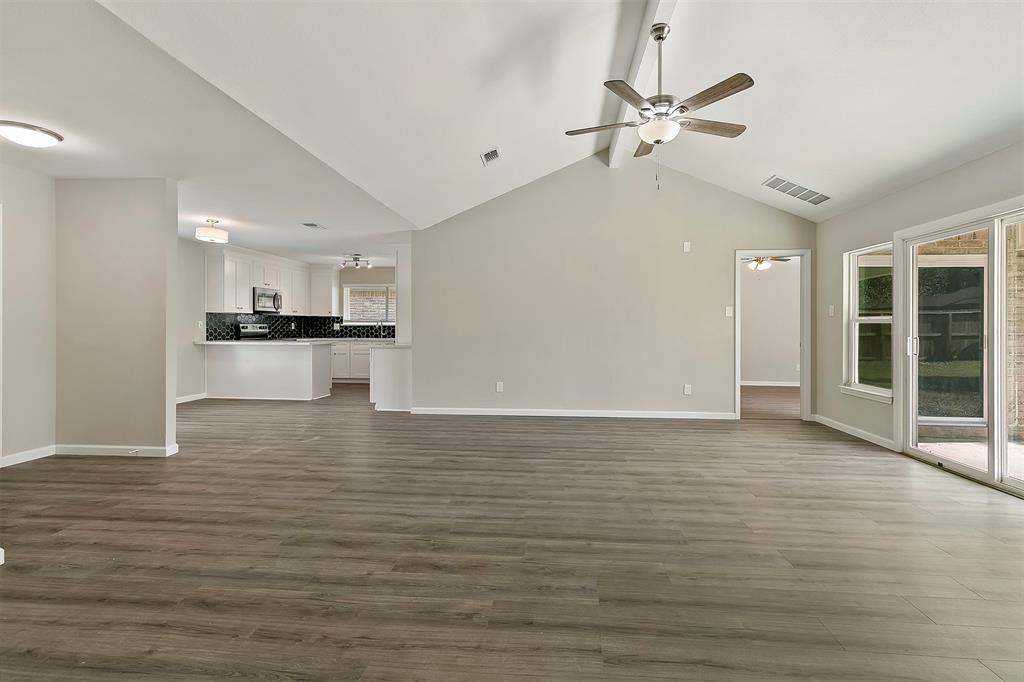
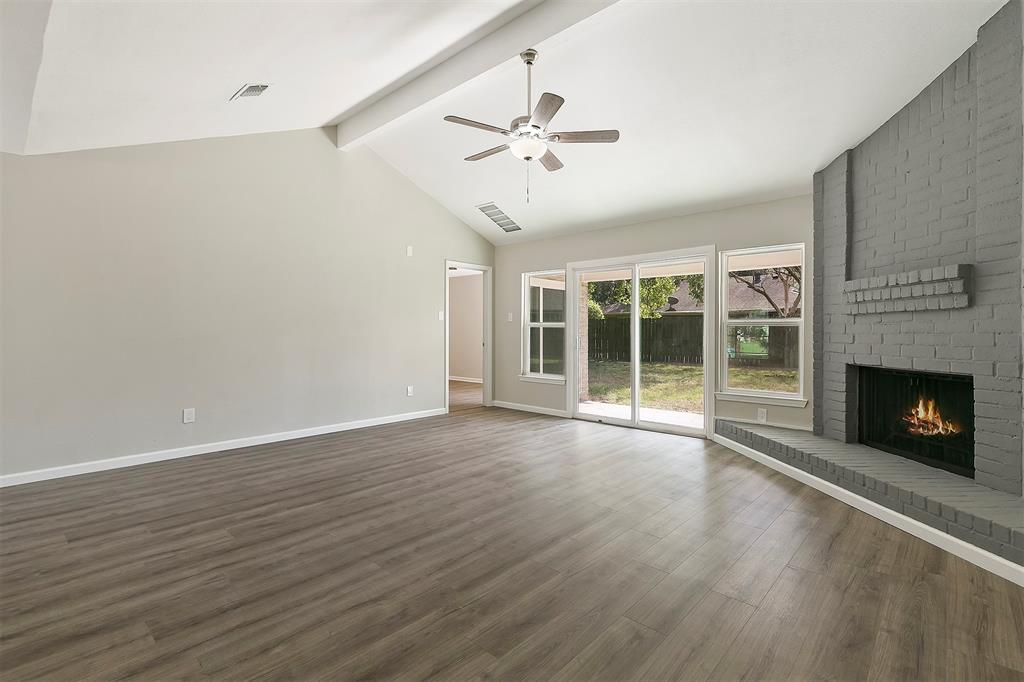
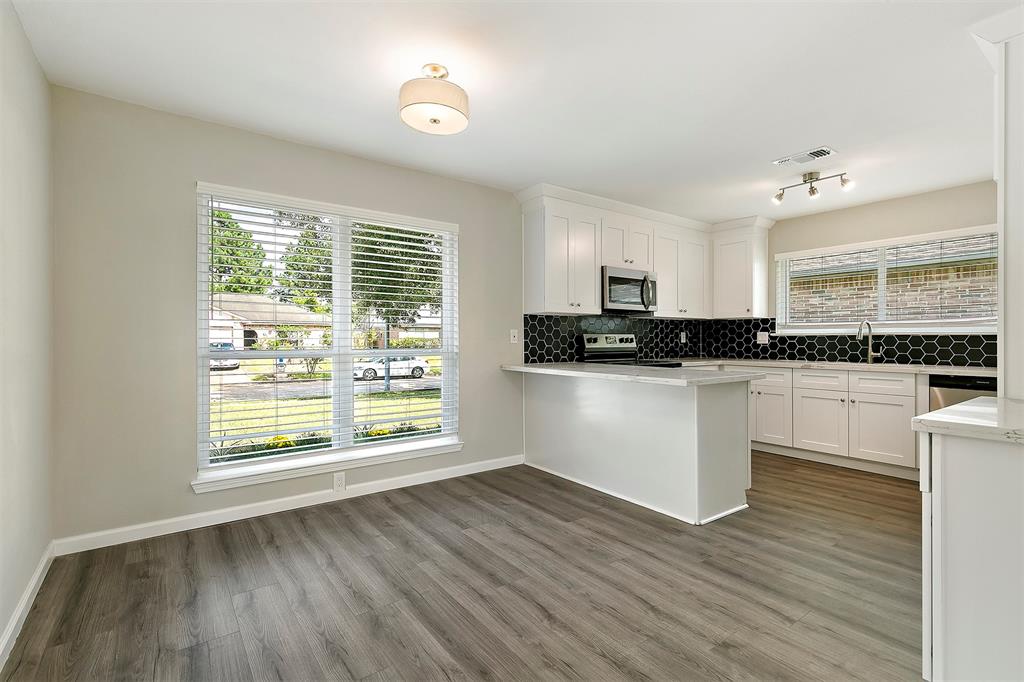
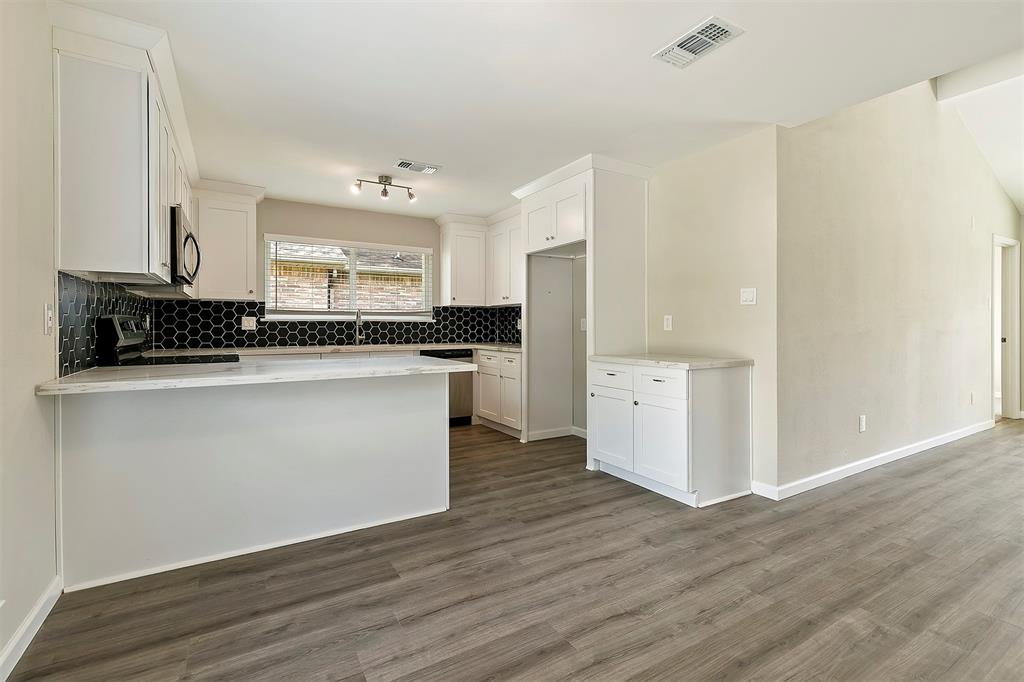
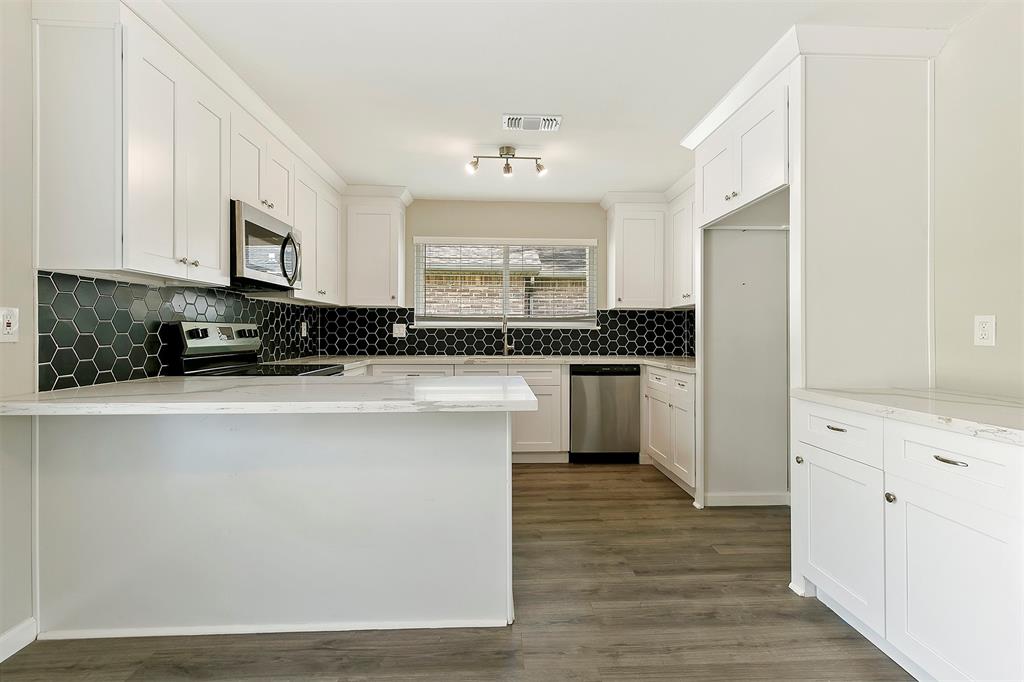
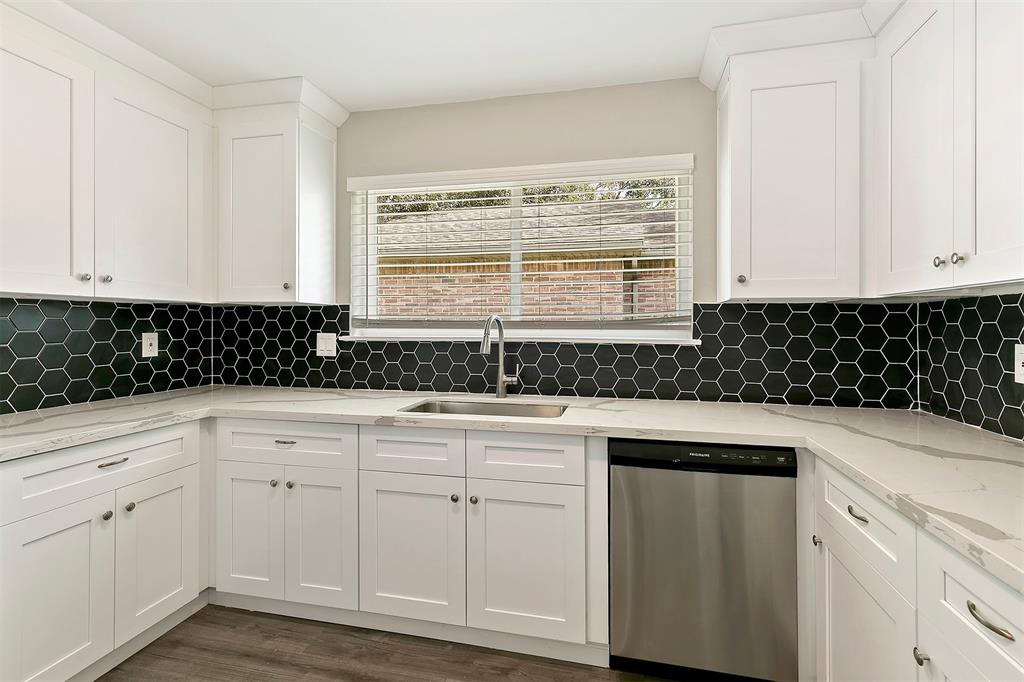
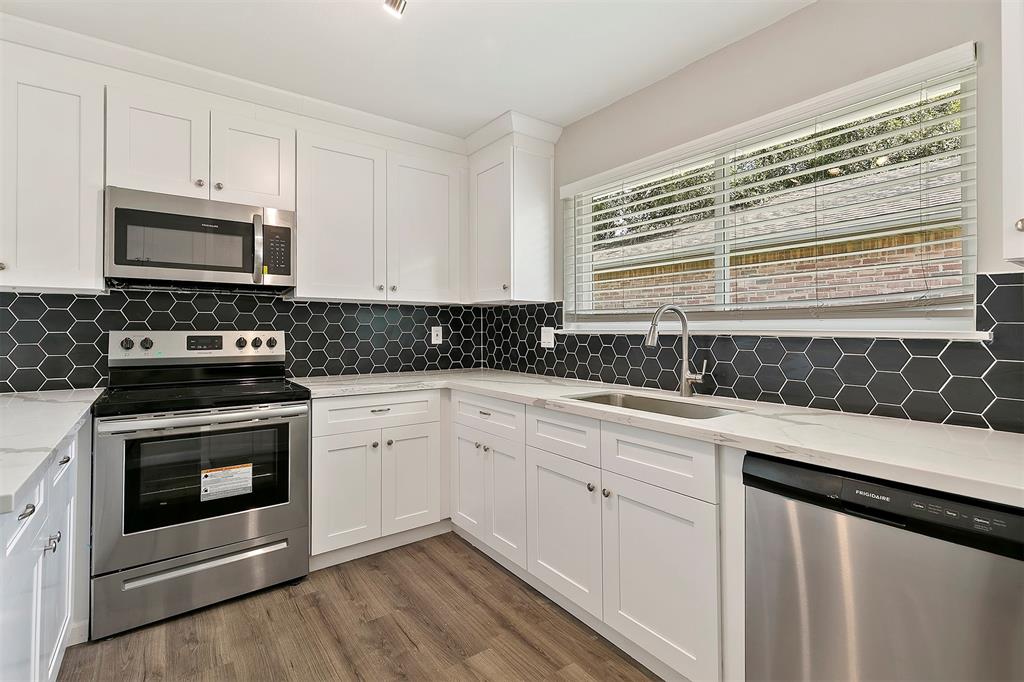
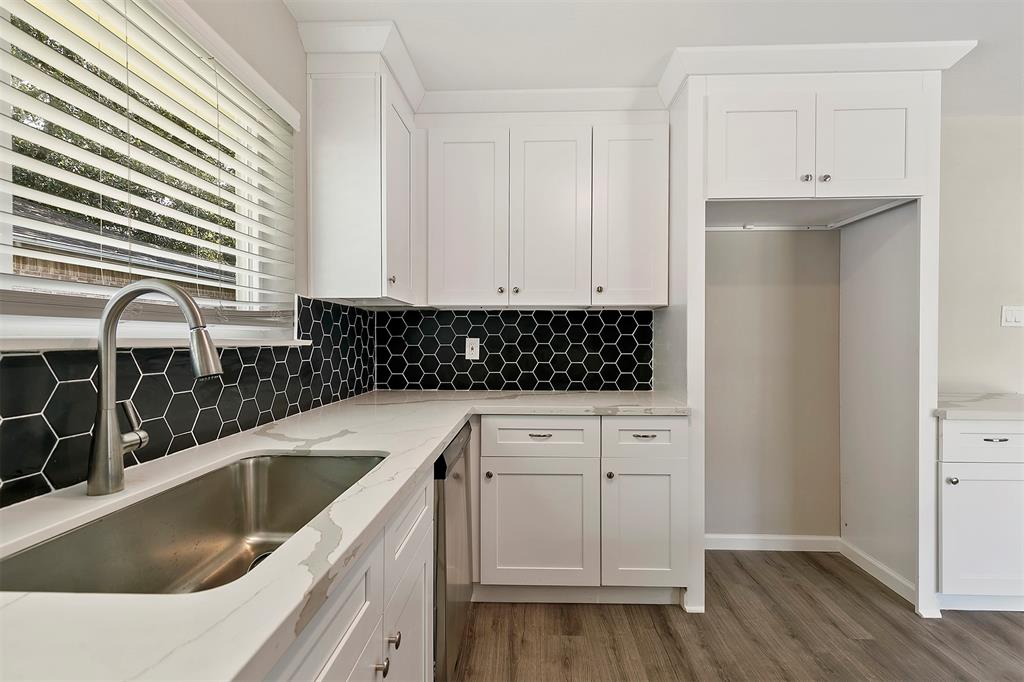
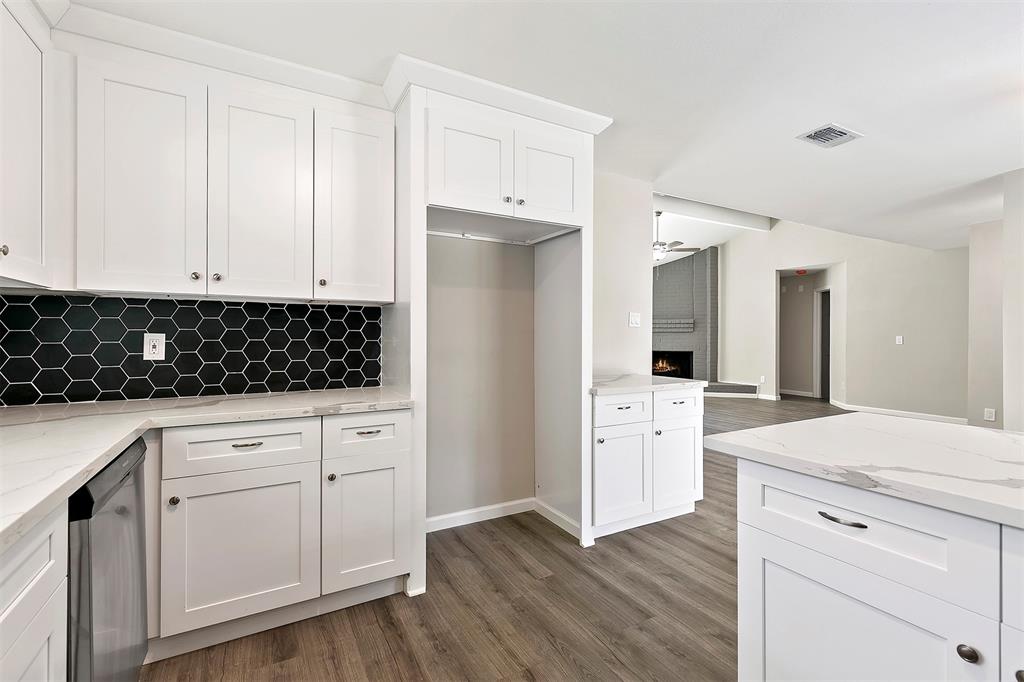
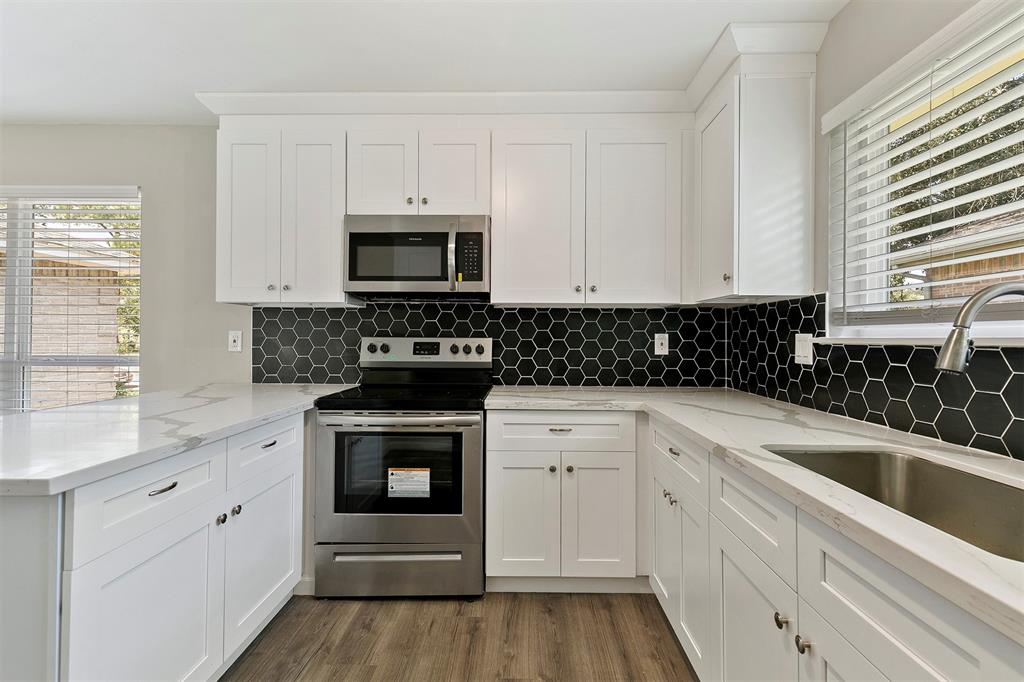
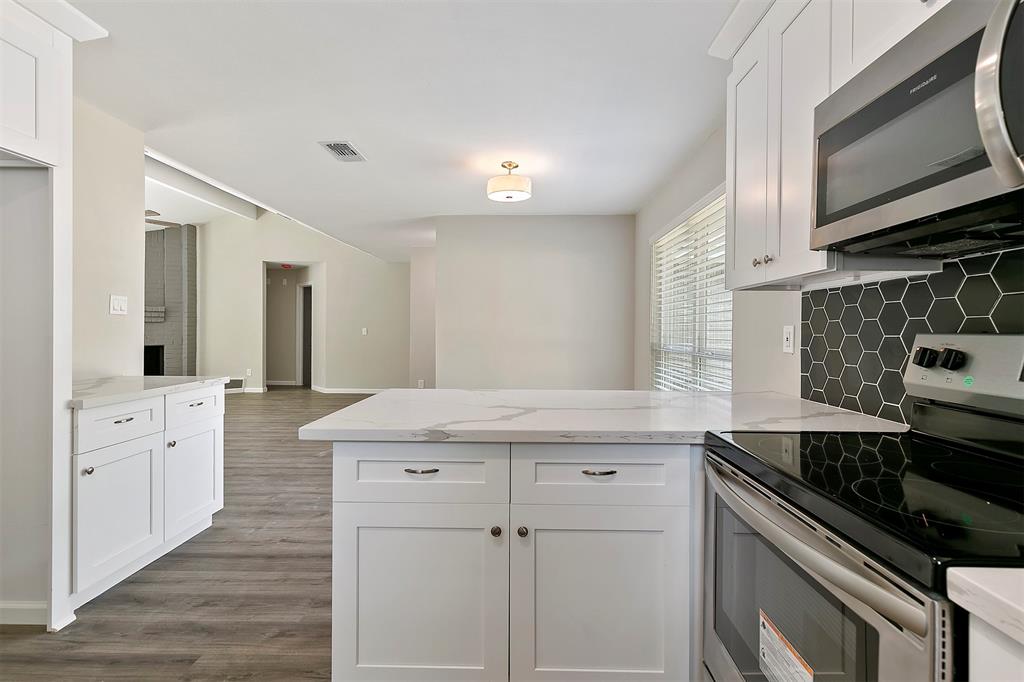
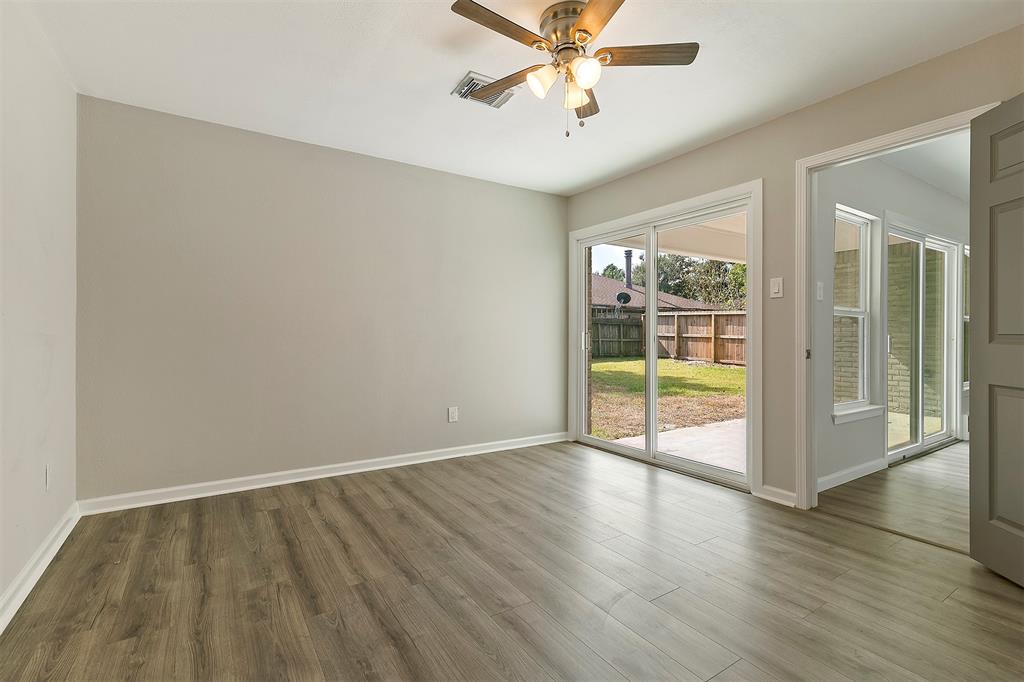
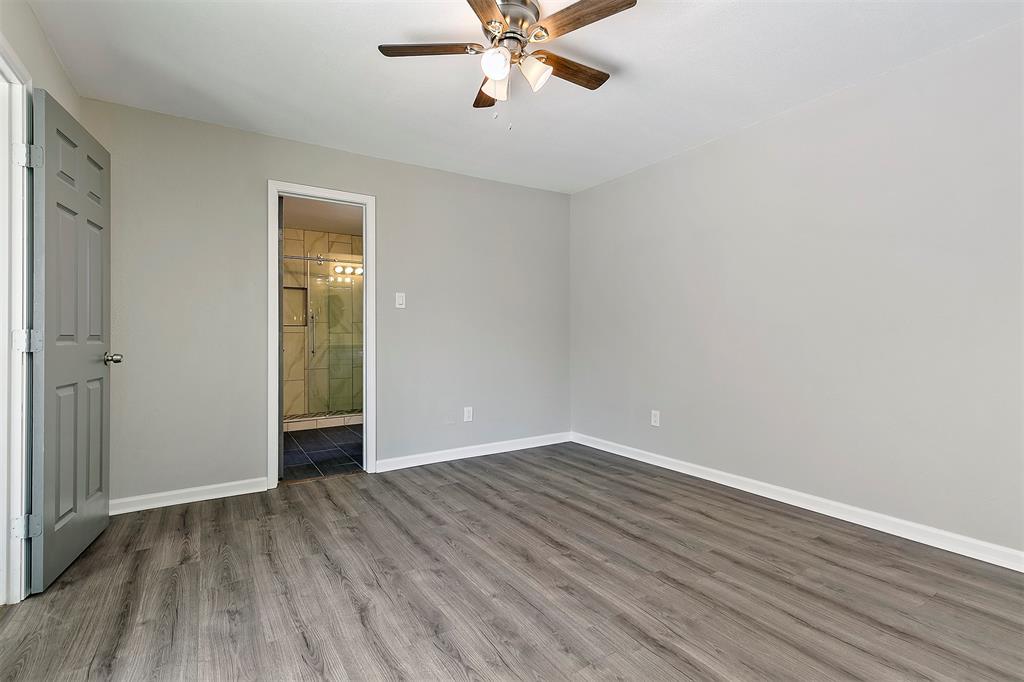
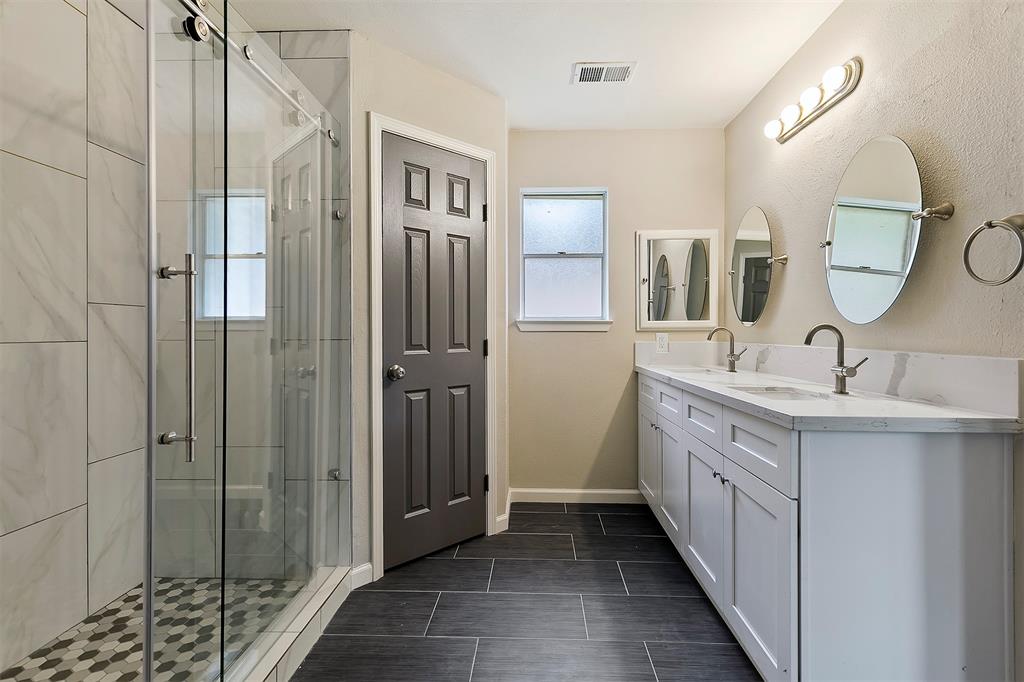
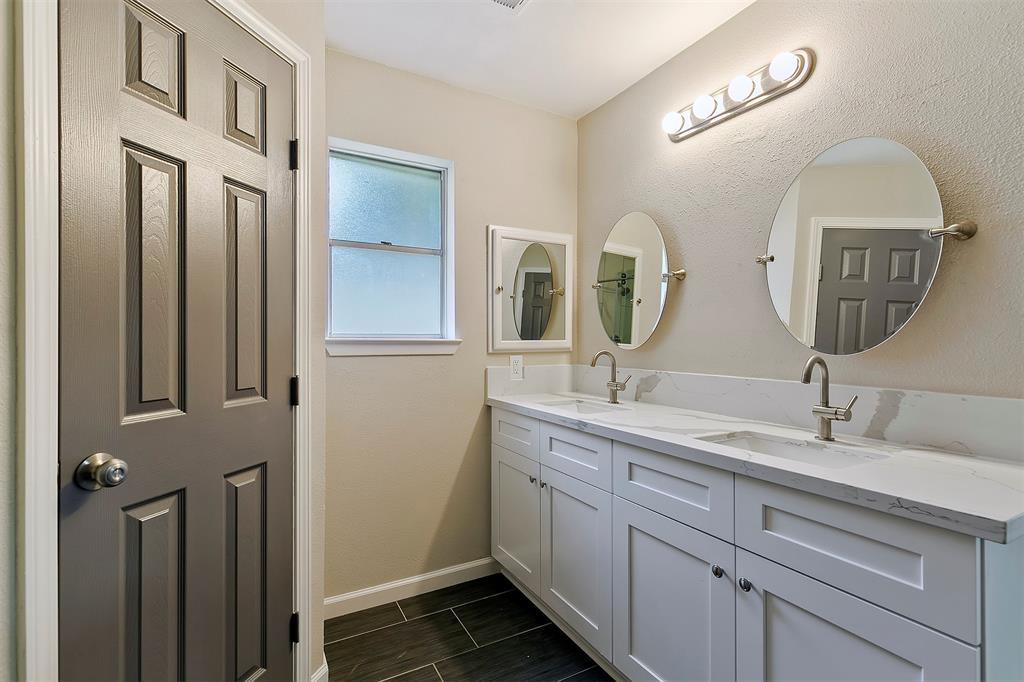
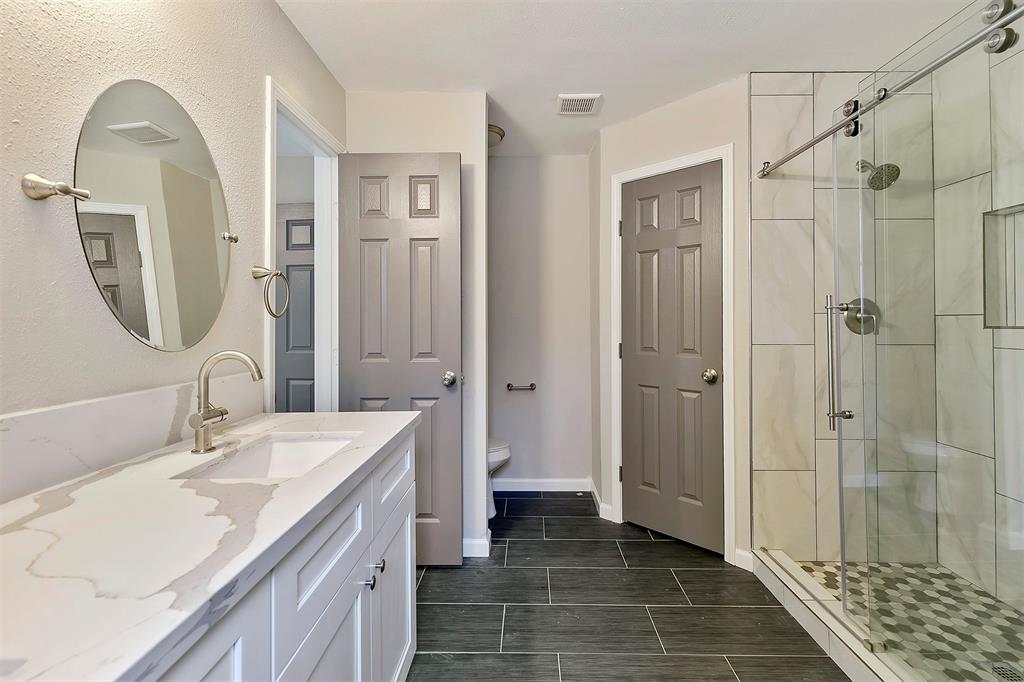
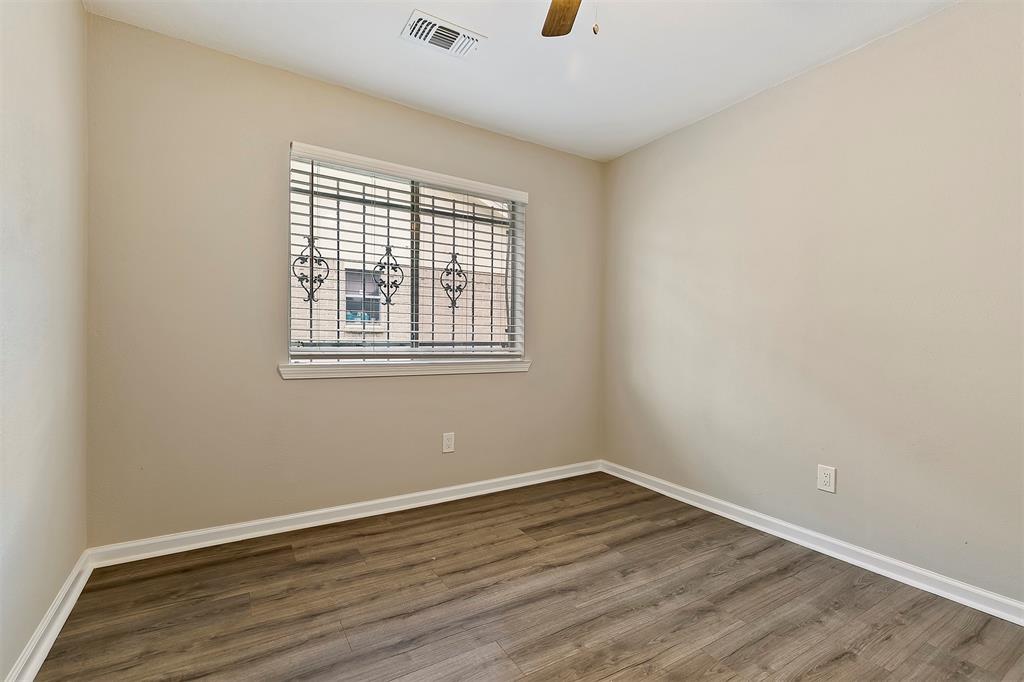
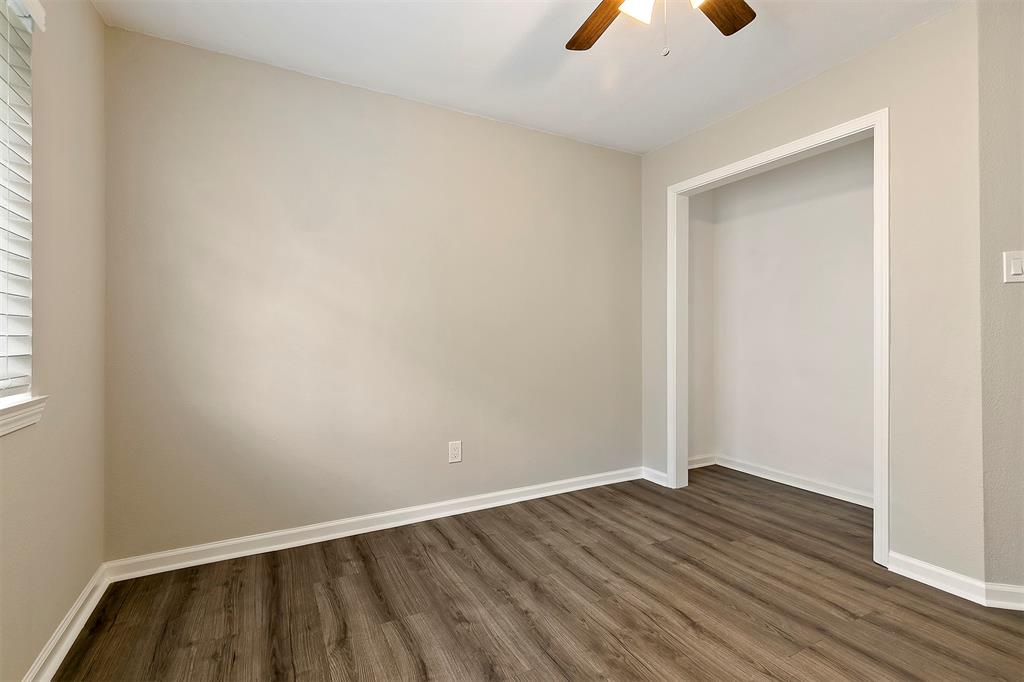
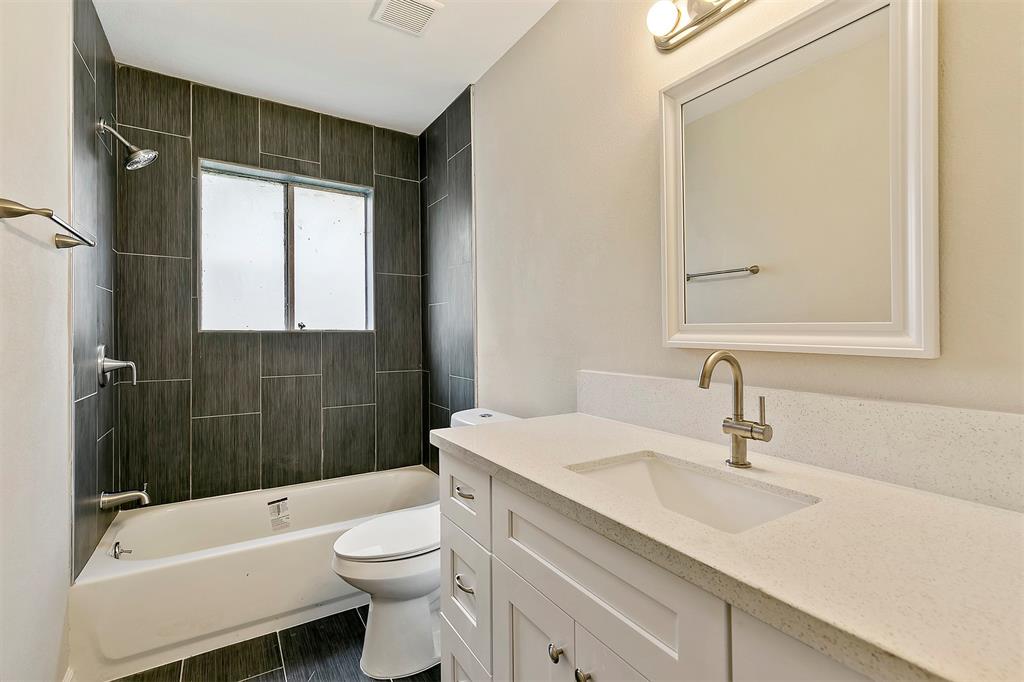
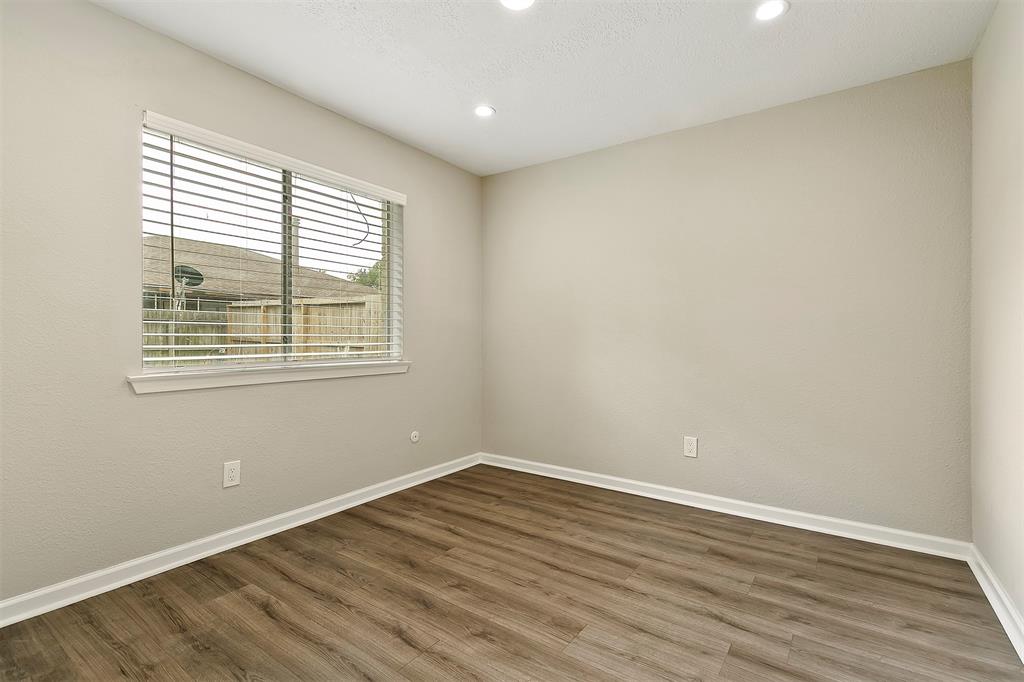
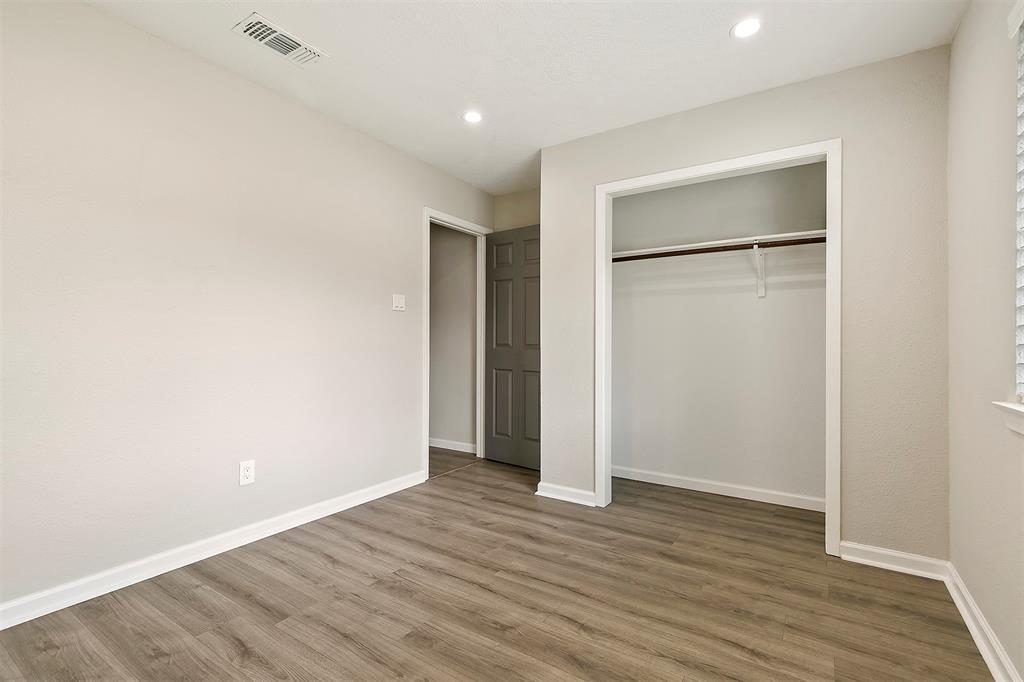
Beautiful top down renovation! This home is practically brand new!! New roof, flooring, paint, kitchen soft-close shaker cabinets with Calacutta quartz countertops, stainless appliances, brand new master bathroom with quartz tops, all new drywall, insulation, windows.. you name it! Fantastic location to the Beltway and I-10. Dont miss this one!!
Premium Content
Get full access to Premium Content
Sold Price for nearby listings,
Property History Reports and more.
Sign Up or
Log In Now
General Description
Sold Price Range:
$250,001 - $285,000
Address:
10615 Juniper Glen Drive
Legal Description:
LT 21 BLK 6 WESTBRANCH SEC 1
Property Type:
Single-Family
Year Built:
1980 / Appraisal District
Building Sqft.:
1,506 140(m²) /Appraisal District
Lot Size:
6,300 Sqft. 585(m²) /Appraisal District
Maintenance Fee:
$ 400 / Annually
Ready to sell your home?
If you are considering selling your home, you may find out how now. Request your home selling analysis featuring Recently Sold, Market Analysis, Home Valuations and Market Update.
GET STARTED
Room Dimension
Primary Bedroom:
14x16, 1st
Interior Features
Kitchen Description:
Breakfast Bar
Bedroom Description:
All Bedrooms Down
Cooling:
Central Electric
Energy Feature:
Ceiling Fans, Digital Program Thermostat
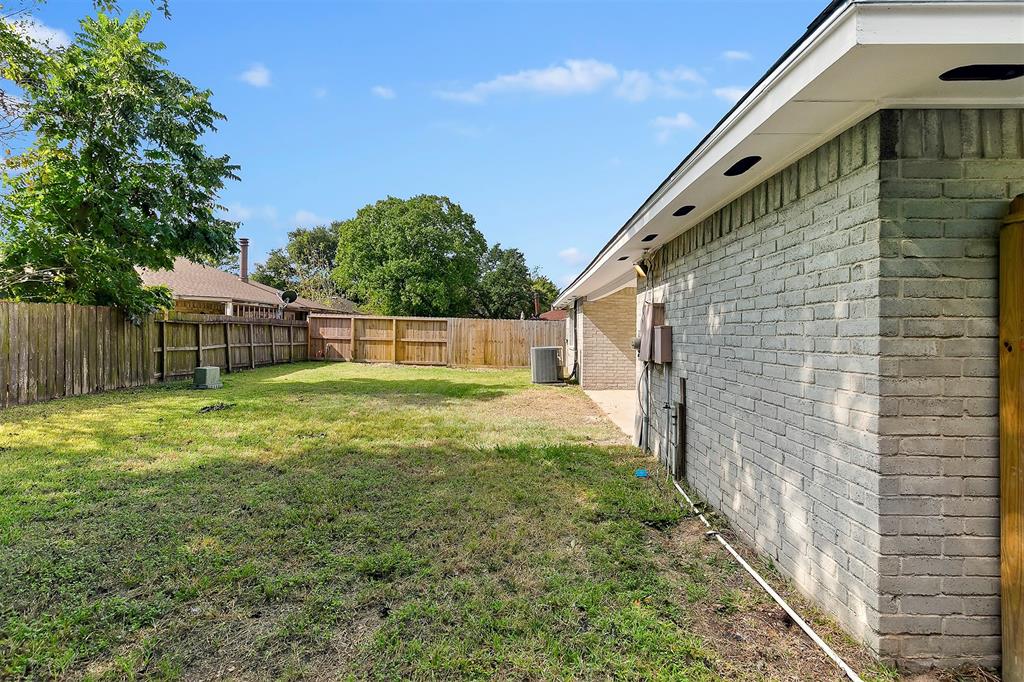
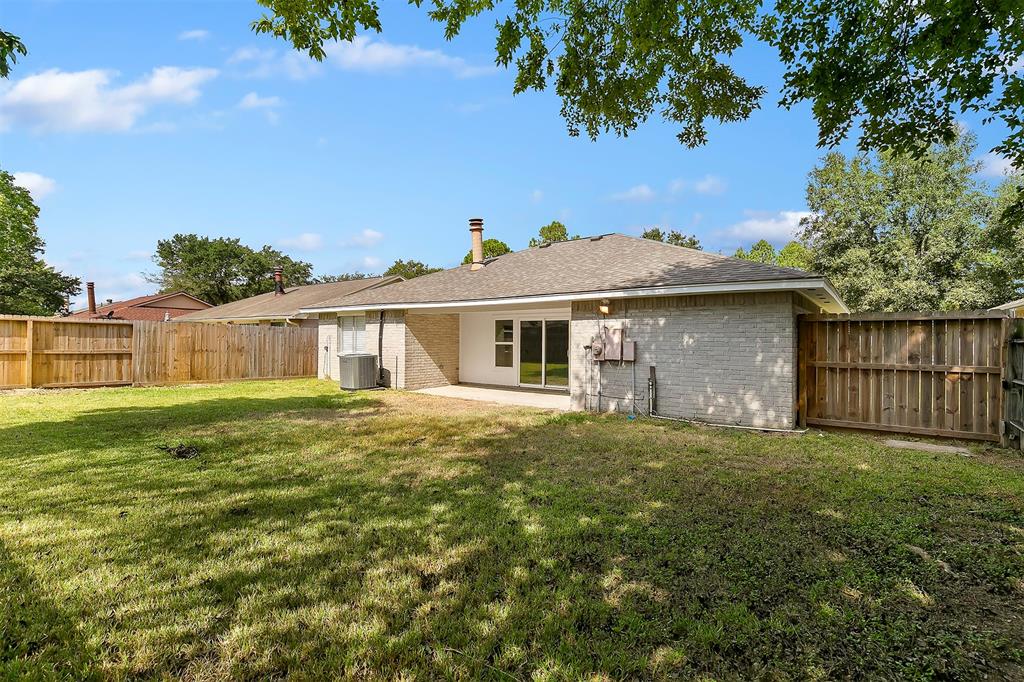
Exterior Features
Exterior Type:
Brick, Wood
Lot Description:
Subdivision Lot
Garage Carport:
Auto Garage Door Opener
Water Sewer:
Public Sewer, Public Water
Unit Location:
Subdivision Lot
Exterior:
Back Yard Fenced
Assigned School Information
School information is computer generated and may not be accurate or current. Buyer must independently verify and confirm enrollment. Please contact the school district to determine the schools to which this property is zoned.
Listing Broker: The Listing Firm
Email Listing Broker
Selling Broker: World Wide Realty,LLC
Last updated as of: 07/17/2024
Property Tax
Market Value Per Appraisal District
Cost/Sqft based on Market Value
Tax Year
Cost/sqft
Market Value
Change
Tax Assessment
Change
2023
$180.37
$271,641
6.41% $271,641
6.41%
2022
$169.51
$255,277
50.92% $255,277
50.92%
2021
$112.32
$169,148
3.02% $169,148
3.02%
2020
$109.03
$164,196
0.00% $164,196
0.00%
2019
$109.03
$164,196
11.09% $164,196
11.09%
2018
$98.14
$147,800
0.00% $147,800
0.00%
2017
$98.14
$147,800
9.74% $147,800
9.74%
2016
$89.43
$134,683
6.49% $134,683
6.49%
2015
$83.98
$126,480
24.55% $126,480
24.55%
2014
$67.43
$101,553
0.00% $101,553
0.00%
2013
$67.43
$101,553
0.00% $101,553
0.00%
2012
$67.43
$101,553
$101,553
2023 Harris County Appraisal District Tax Value
Market Land Value:
$58,905
Market Improvement Value:
$212,736
Total Market Value : $271,641
2023 Tax Rates
CYPRESS-FAIRBANKS ISD:
1.0811 %
HARRIS COUNTY:
0.3501 %
HC FLOOD CONTROL DIST:
0.0311 %
PORT OF HOUSTON AUTHORITY:
0.0057 %
HC HOSPITAL DIST:
0.1434 %
HC DEPARTMENT OF EDUCATION:
0.0048 %
LONE STAR COLLEGE SYS:
0.1076 %
HOUSTON CITY OF:
0.5192 %
SPRING BRANCH MGMT DISTRICT:
0.1000 %
Total Tax Rate : 2.3430 %