Sold Price Range: $250,001 - $285,000
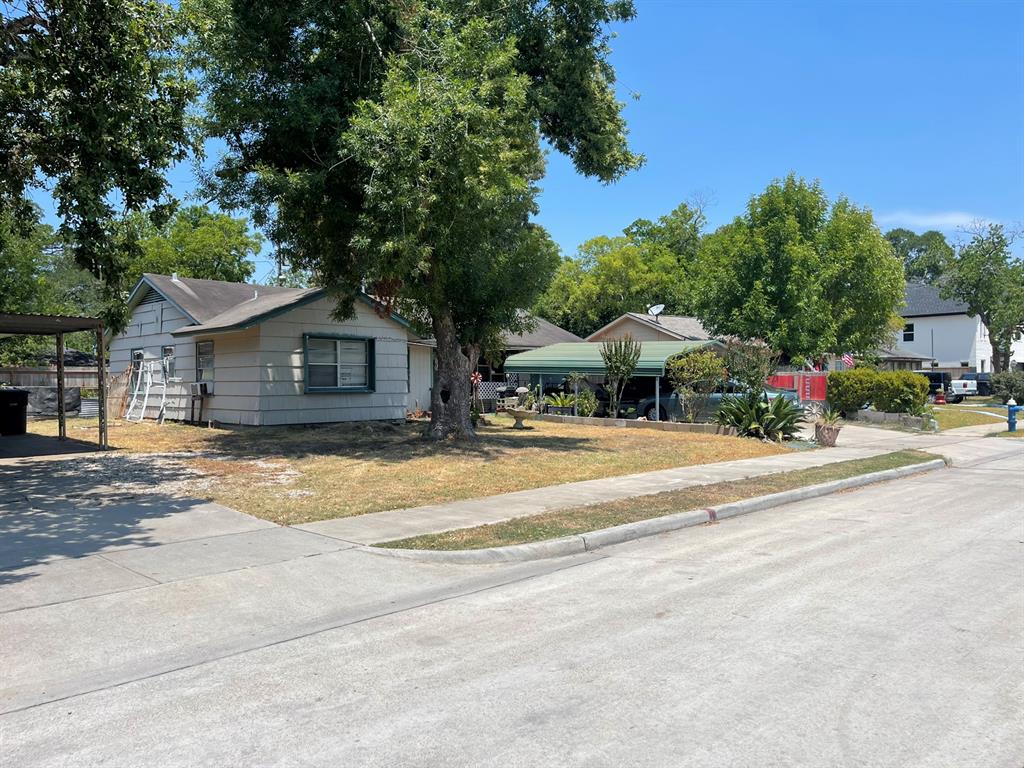
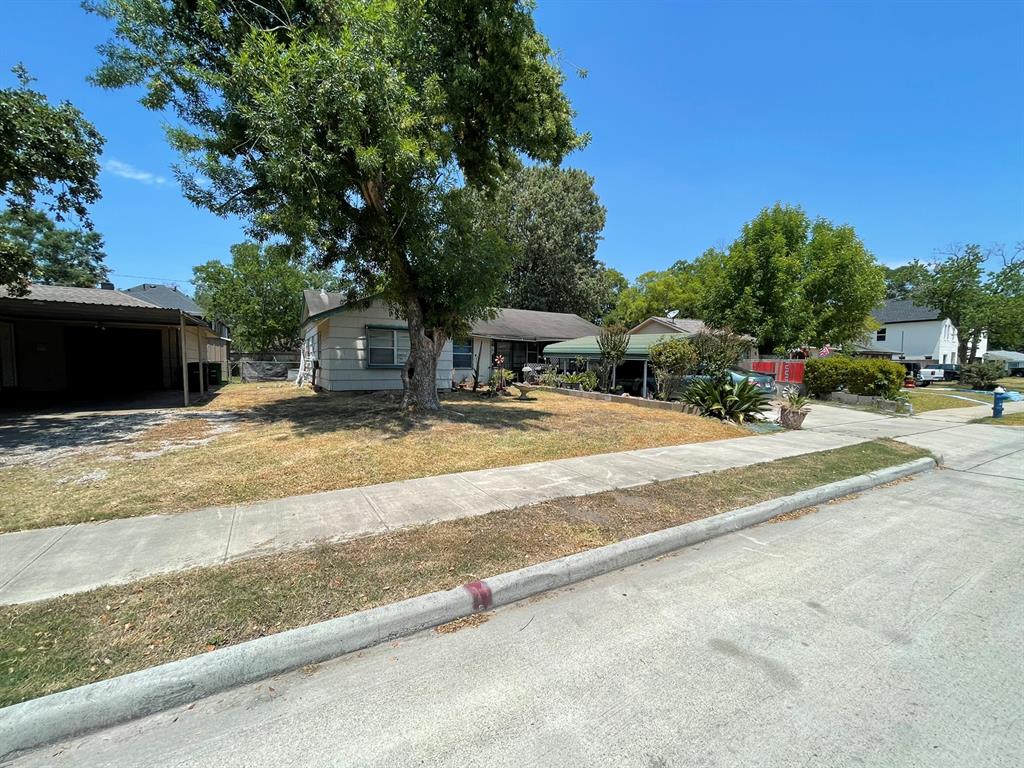
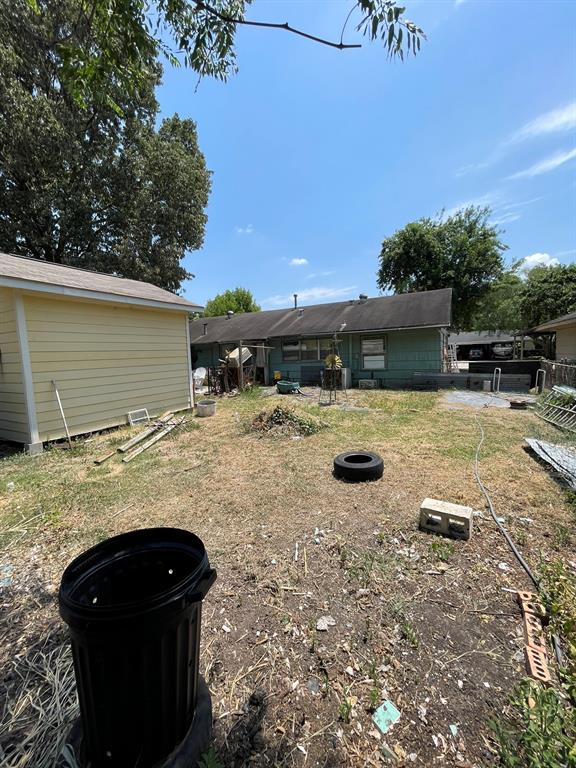
Location, location, location!!!! Home sits on a large, unrestricted lot. Property is being sold as-is. All Measurements are approximate, buyer should measure for accuracy. Buyer to purchase new survey.
Premium Content
Get full access to Premium Content
Sold Price for nearby listings,
Property History Reports and more.
Sign Up or
Log In Now
General Description
Sold Price Range:
$250,001 - $285,000
Address:
1925 Lynnview Drive
Legal Description:
LT 20 BLK 1 GLENVIEW SEC 1
Property Type:
Single-Family
Baths:
1 Full & 1 Half Bath(s)
Year Built:
1955 / Appraisal District
Building Sqft.:
1,070 99(m²) /Appraisal District
Lot Size:
6,760 Sqft. 628(m²) /Appraisal District
Ready to sell your home?
If you are considering selling your home, you may find out how now. Request your home selling analysis featuring Recently Sold, Market Analysis, Home Valuations and Market Update.
GET STARTED
Interior Features
Energy Feature:
Attic Vents
Exterior Features
Lot Description:
Subdivision Lot
Water Sewer:
Public Sewer, Public Water
Unit Location:
Subdivision Lot
Assigned School Information
School information is computer generated and may not be accurate or current. Buyer must independently verify and confirm enrollment. Please contact the school district to determine the schools to which this property is zoned.
Listing Broker: Realty Associates
Email Listing Broker
Selling Broker: Better Homes and Gardens Real Estate Gary Greene - Memorial
Last updated as of: 07/14/2024
Property Tax
Market Value Per Appraisal District
Cost/Sqft based on Market Value
Tax Year
Cost/sqft
Market Value
Change
Tax Assessment
Change
2023
$261.69
$280,005
19.47% $280,005
19.47%
2022
$219.04
$234,378
13.76% $234,378
52.53%
2021
$192.55
$206,028
1.40% $153,660
10.00%
2020
$189.89
$203,180
0.00% $139,691
10.00%
2019
$189.89
$203,180
42.09% $126,992
10.00%
2018
$133.64
$142,998
0.00% $115,448
10.00%
2017
$133.64
$142,998
1.74% $104,953
10.00%
2016
$131.36
$140,552
19.79% $95,412
10.00%
2015
$109.66
$117,335
48.80% $86,739
10.00%
2014
$73.70
$78,854
0.00% $78,854
0.00%
2013
$73.70
$78,854
0.00% $78,854
0.00%
2012
$73.70
$78,854
$78,854
2023 Harris County Appraisal District Tax Value
Market Land Value:
$223,080
Market Improvement Value:
$56,925
Total Market Value : $280,005
2023 Tax Rates
SPRING BRANCH ISD:
1.0789 %
HARRIS COUNTY:
0.3501 %
HC FLOOD CONTROL DIST:
0.0311 %
PORT OF HOUSTON AUTHORITY:
0.0057 %
HC HOSPITAL DIST:
0.1434 %
HC DEPARTMENT OF EDUCATION:
0.0048 %
HOUSTON CITY OF:
0.5192 %
SPRING BRANCH MGMT DISTRICT:
0.1000 %
Total Tax Rate : 2.2332 %