Sold Price Range: $215,001 - $250,000
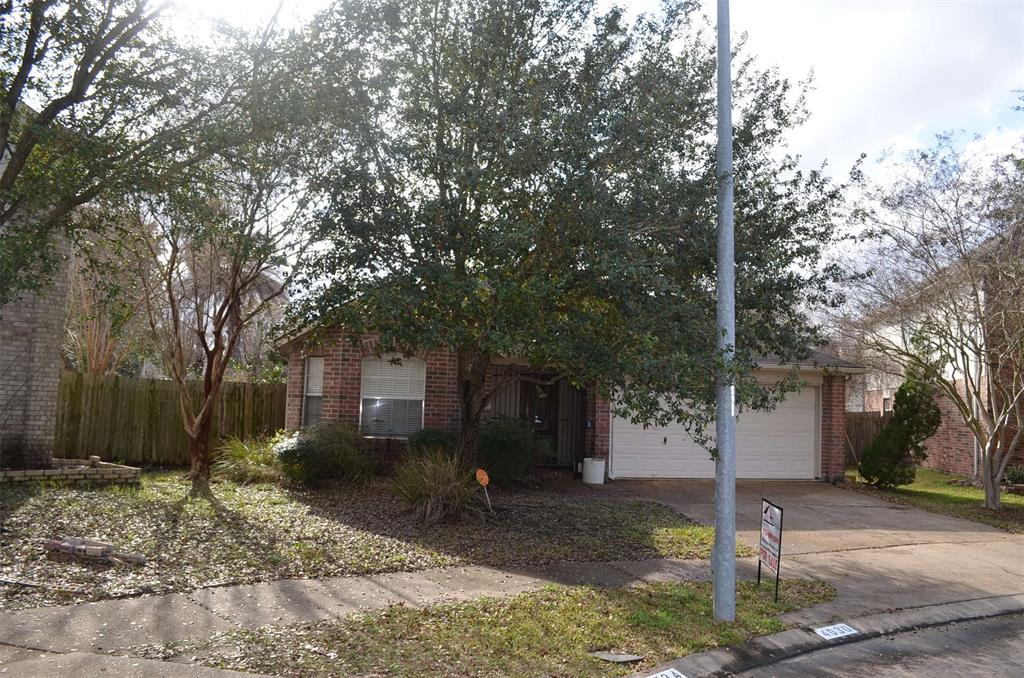
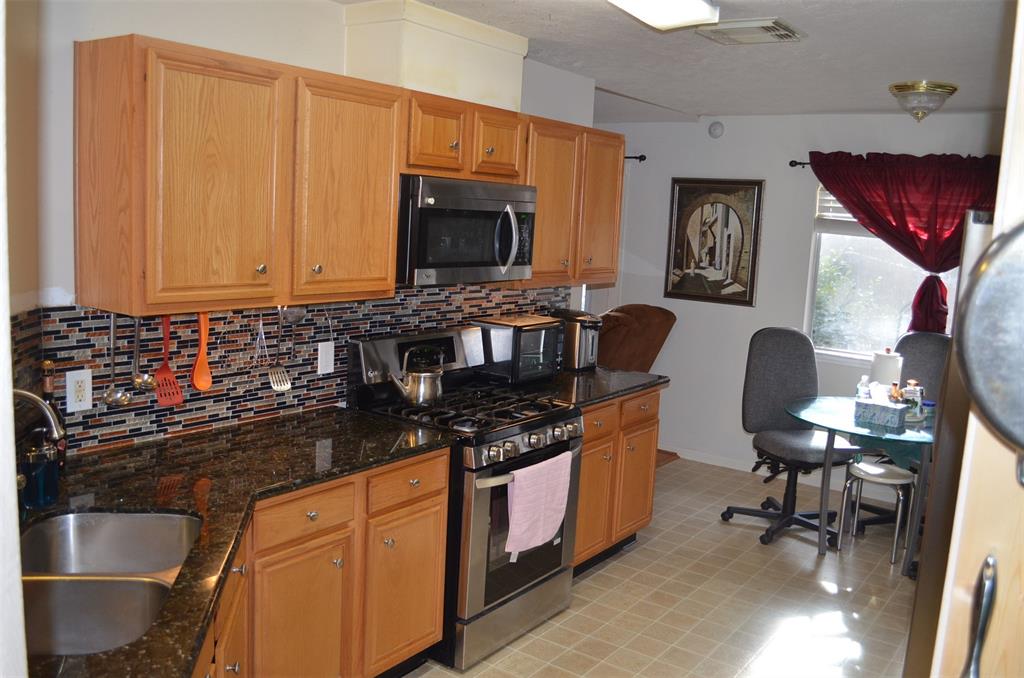
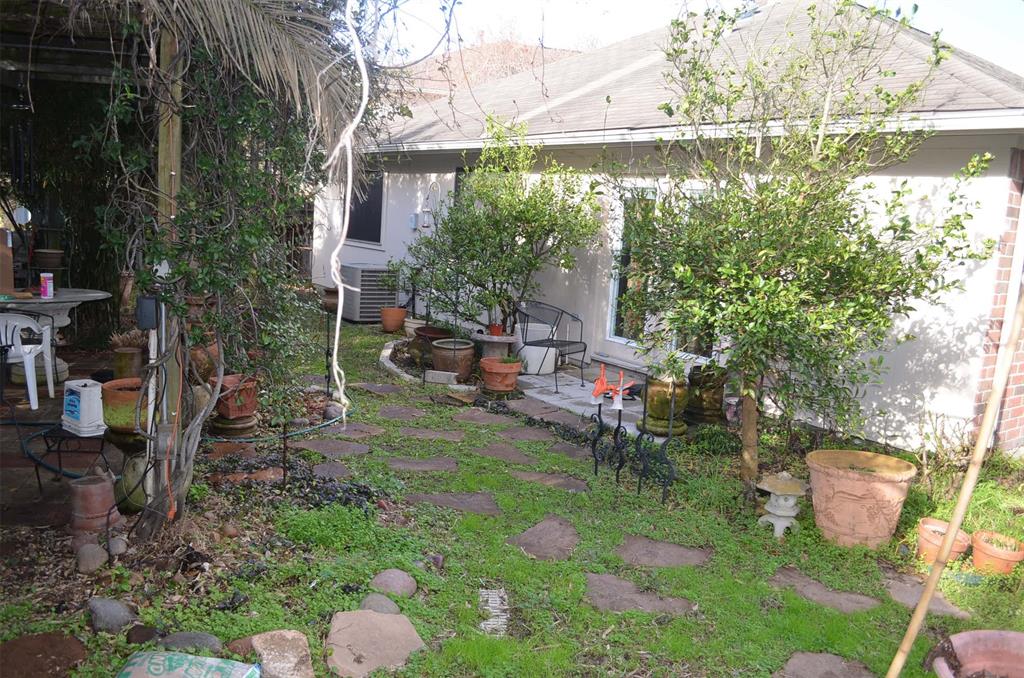
Home on a huge cul de sac - Large back yard. Updated master bath with large shower, walk in closet, added linen closet, double sinks. Split plan with guest bathroom in between the secondary bedrooms. Good flow floor plan and great for entertaining with combo dining and living area.
Premium Content
Get full access to Premium Content
Sold Price for nearby listings,
Property History Reports and more.
Sign Up or
Log In Now
General Description
Sold Price Range:
$215,001 - $250,000
Address:
4030 Clayton Bend Court
Legal Description:
LT 17 BLK 3 CLAYTON GREENS
Property Type:
Single-Family
Year Built:
2001 / Appraisal District
Building Sqft.:
1,761 164(m²) /Appraisal District
Lot Size:
10,263 Sqft. 953(m²) /Appraisal District
Maintenance Fee:
$ 475 / Annually
Ready to sell your home?
If you are considering selling your home, you may find out how now. Request your home selling analysis featuring Recently Sold, Market Analysis, Home Valuations and Market Update.
GET STARTED
Room Dimension
Primary Bedroom:
20x15, 1st
Utility Room Desc:
8x6, 1st
Interior Features
Room Description:
Breakfast Room, Utility Room in House
Cooling:
Central Electric
Connections:
Gas Dryer Connections, Washer Connections
Energy Feature:
Ceiling Fans, Digital Program Thermostat
Interior:
Drapes/Curtains/Window Cover, High Ceiling
Exterior Features
Exterior Type:
Brick, Cement Board
Lot Description:
Cul-De-Sac
Water Sewer:
Water District
Unit Location:
Cul-De-Sac
Exterior:
Back Yard, Back Yard Fenced, Fully Fenced, Patio/Deck, Side Yard
Assigned School Information
School information is computer generated and may not be accurate or current. Buyer must independently verify and confirm enrollment. Please contact the school district to determine the schools to which this property is zoned.
Listing Broker: MYLE Connections
Email Listing Broker
Selling Broker: eXp Realty LLC
Last updated as of: 08/07/2024
Property Tax
Market Value Per Appraisal District
Cost/Sqft based on Market Value
Tax Year
Cost/sqft
Market Value
Change
Tax Assessment
Change
2023
$156.75
$276,029
17.05% $276,029
17.05%
2022
$133.92
$235,829
33.60% $235,829
33.60%
2021
$100.23
$176,513
4.16% $176,513
4.16%
2020
$96.24
$169,470
6.22% $169,470
6.22%
2019
$90.60
$159,545
1.57% $159,545
1.57%
2018
$89.20
$157,084
0.00% $157,084
0.00%
2017
$89.20
$157,084
7.41% $157,084
7.41%
2016
$83.04
$146,242
2.42% $146,242
6.28%
2015
$81.09
$142,791
14.15% $137,596
10.00%
2014
$71.03
$125,088
20.76% $125,088
20.76%
2013
$58.82
$103,583
2.56% $103,583
2.56%
2012
$57.35
$101,000
$101,000
2023 Harris County Appraisal District Tax Value
Market Land Value:
$62,013
Market Improvement Value:
$214,016
Total Market Value : $276,029
2023 Tax Rates
ALIEF ISD:
0.9867 %
HARRIS COUNTY:
0.3501 %
HC FLOOD CONTROL DIST:
0.0311 %
PORT OF HOUSTON AUTHORITY:
0.0057 %
HC HOSPITAL DIST:
0.1434 %
HC DEPARTMENT OF EDUCATION:
0.0048 %
HOUSTON COMMUNITY COLLEGE:
0.0922 %
HC MUD 120:
0.4000 %
HARRIS-FT BEND ESD 100:
0.0853 %
Total Tax Rate : 2.0994 %