Sold Price Range: $285,001 - $325,000
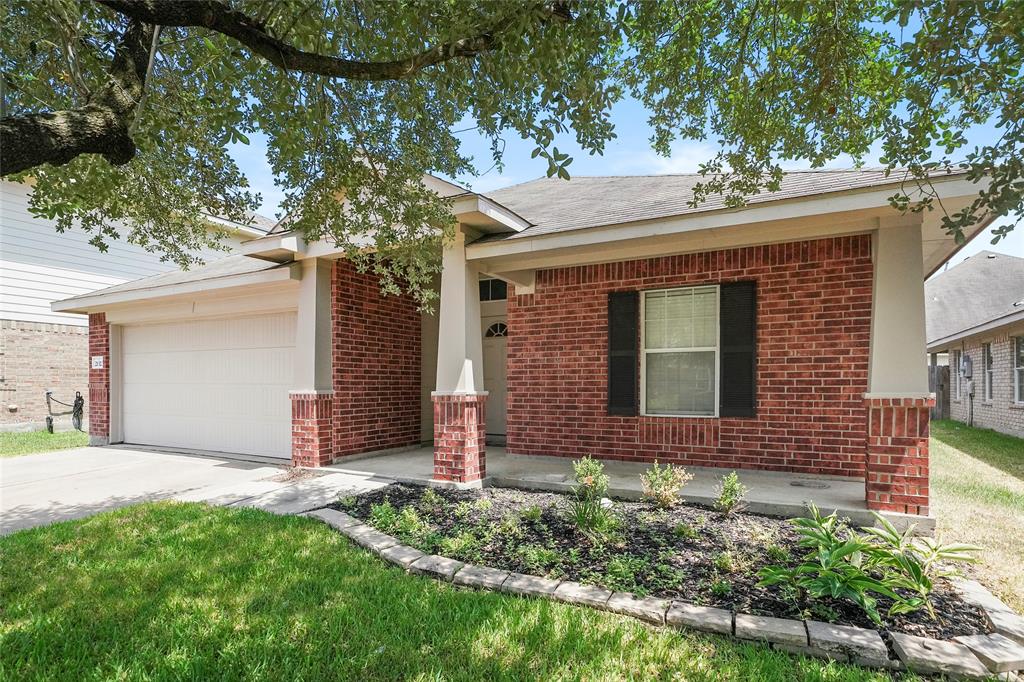
Welcome home!
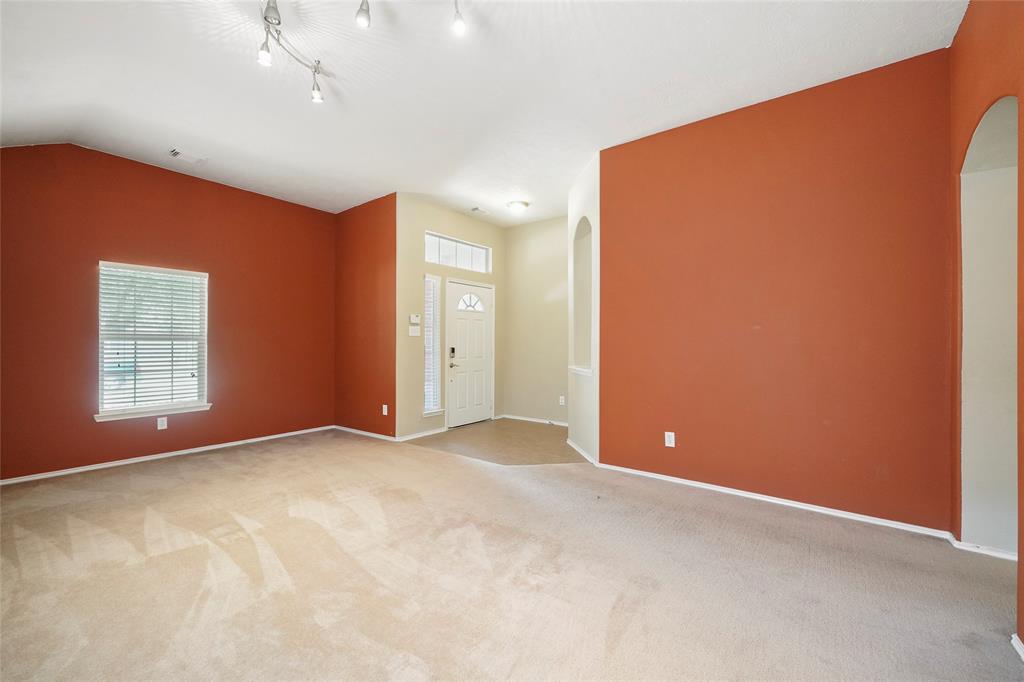
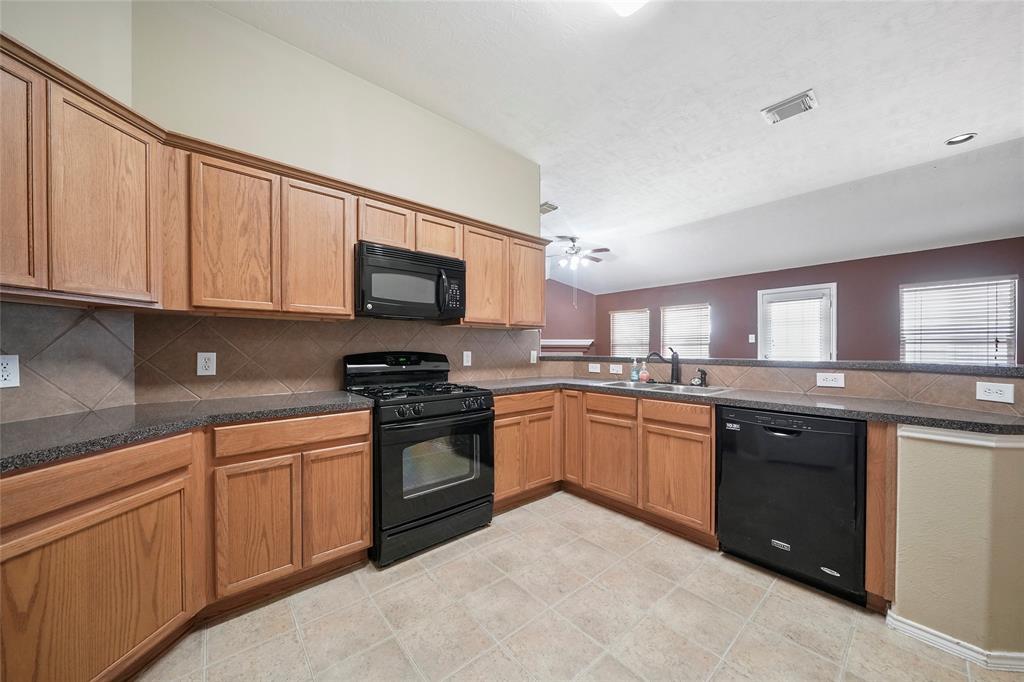
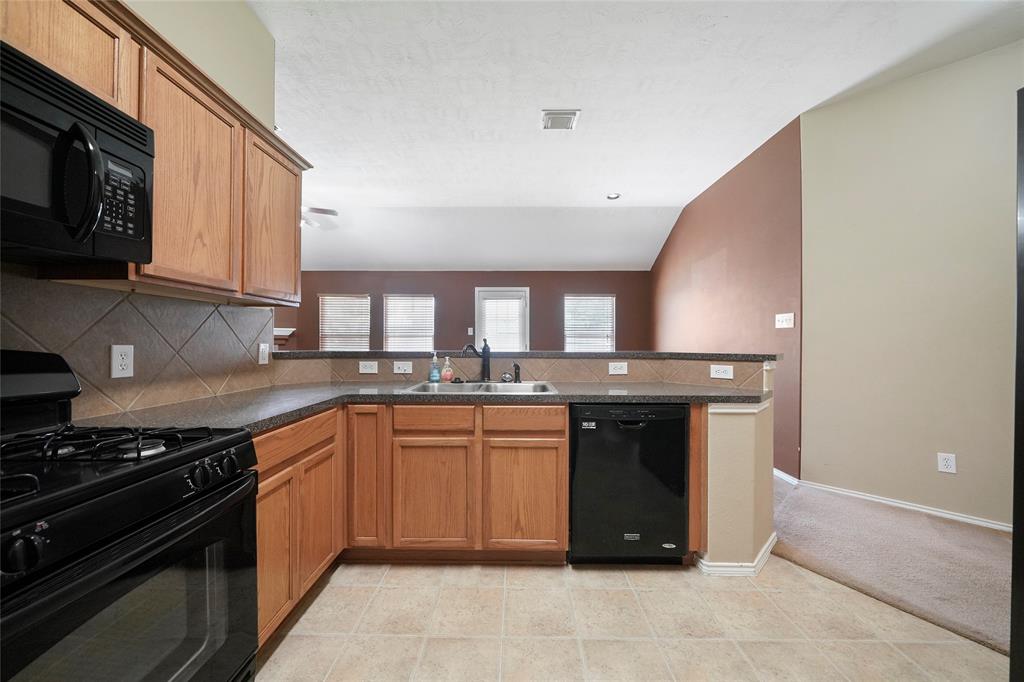
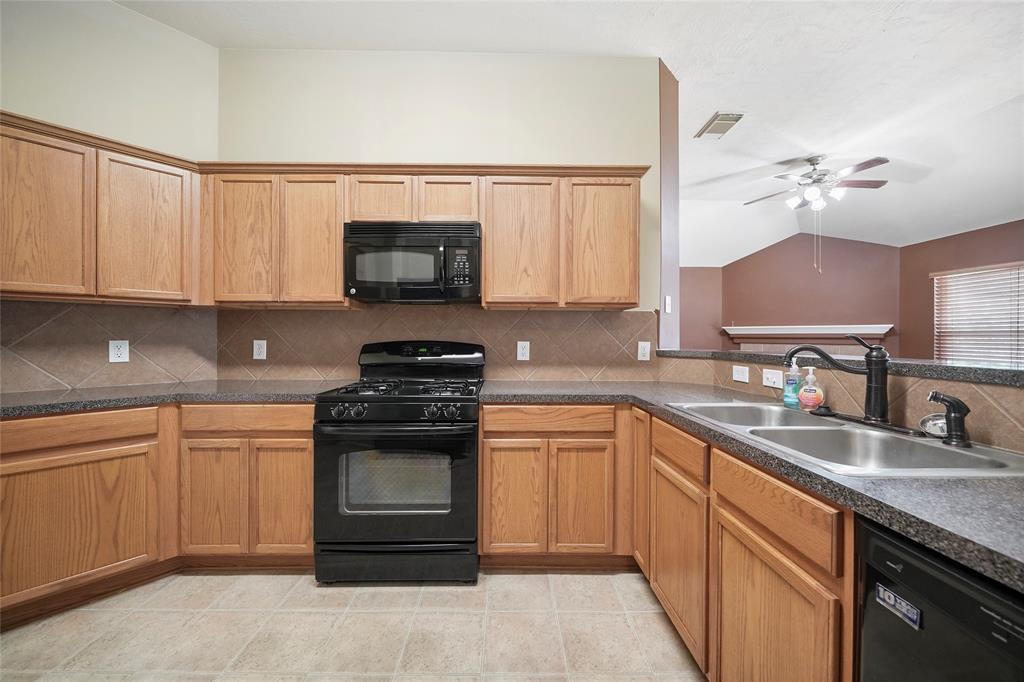
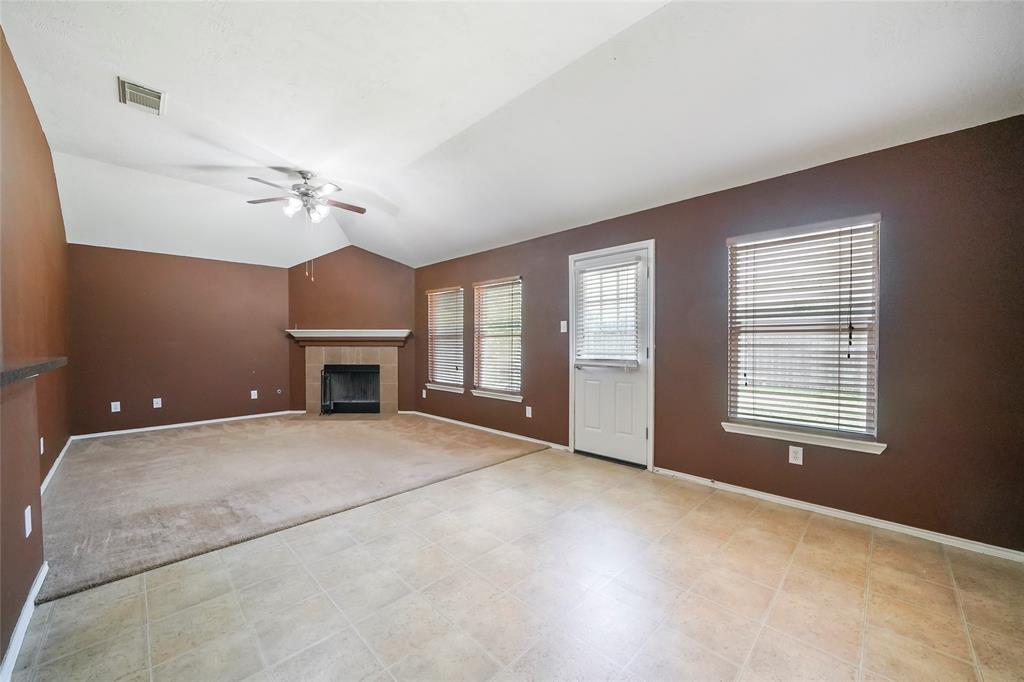
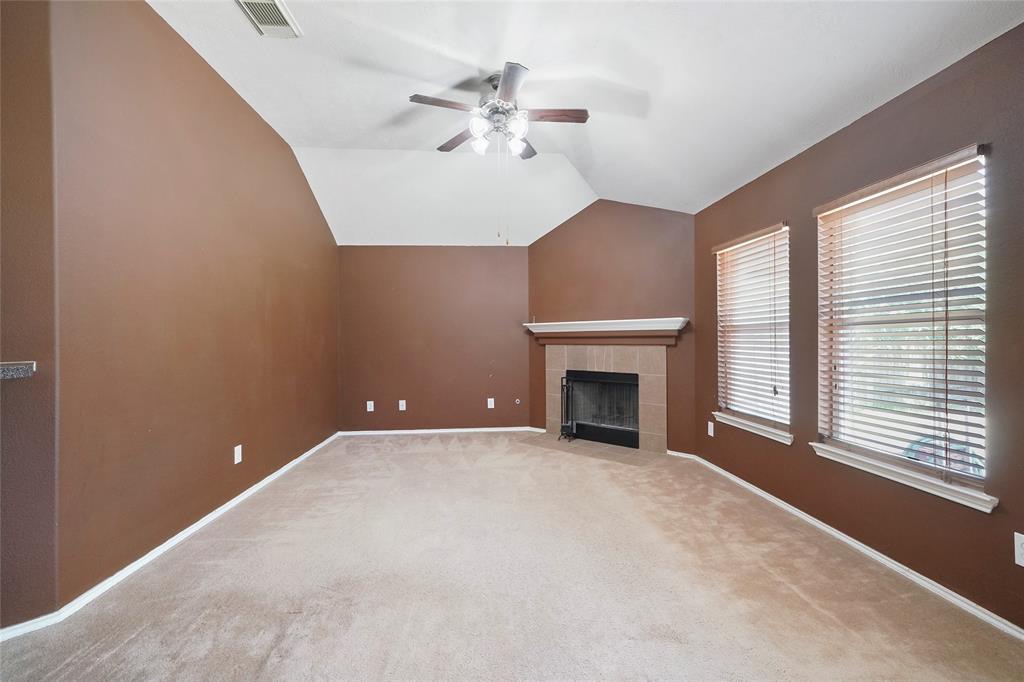
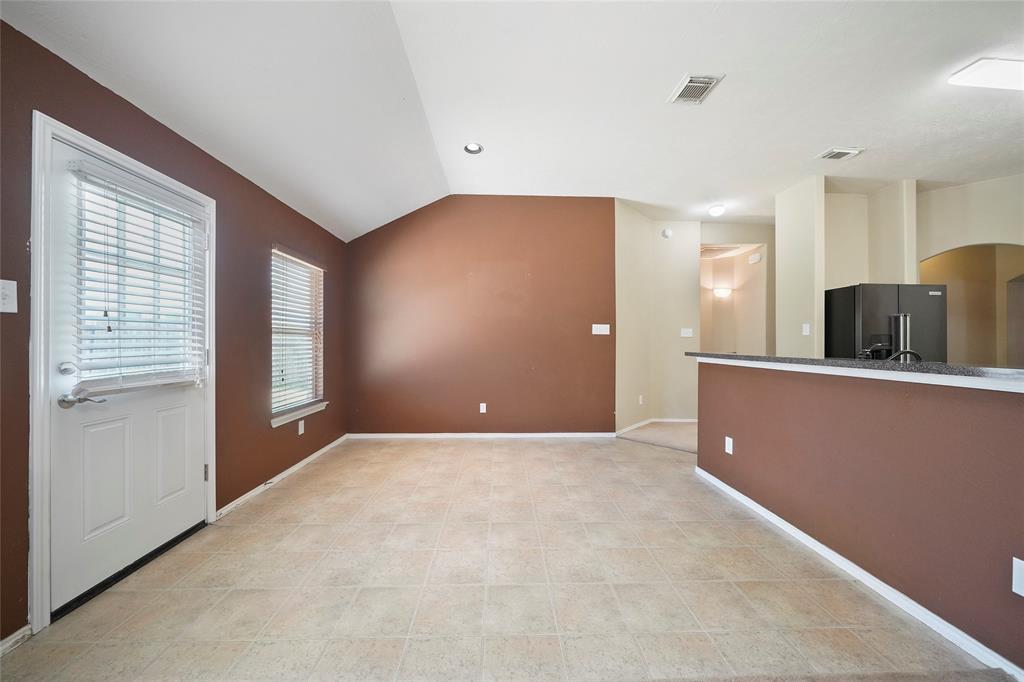
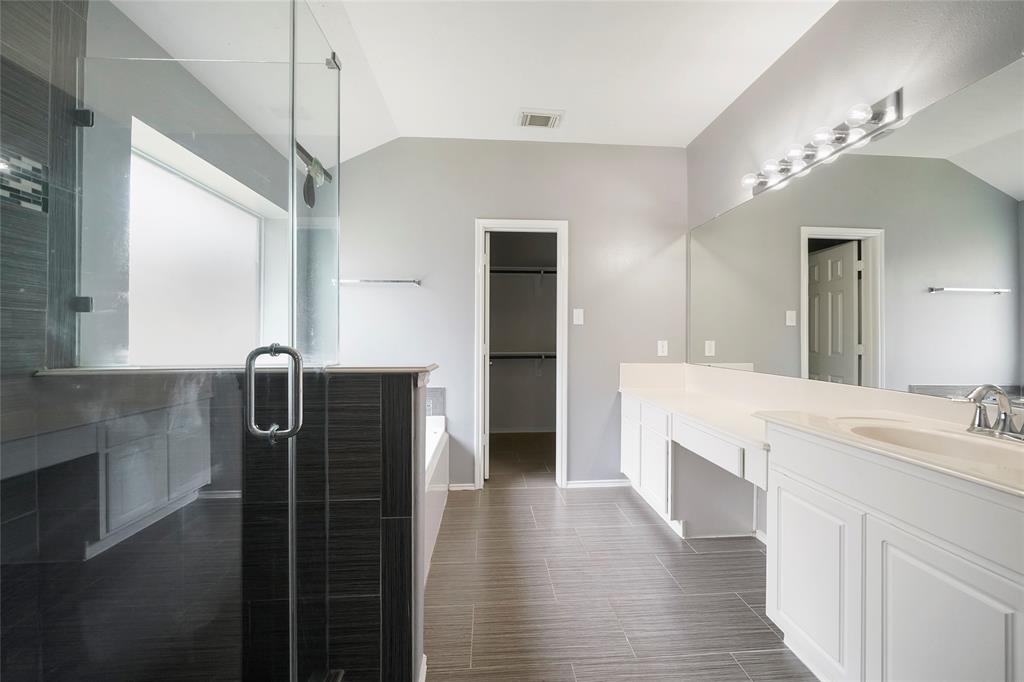
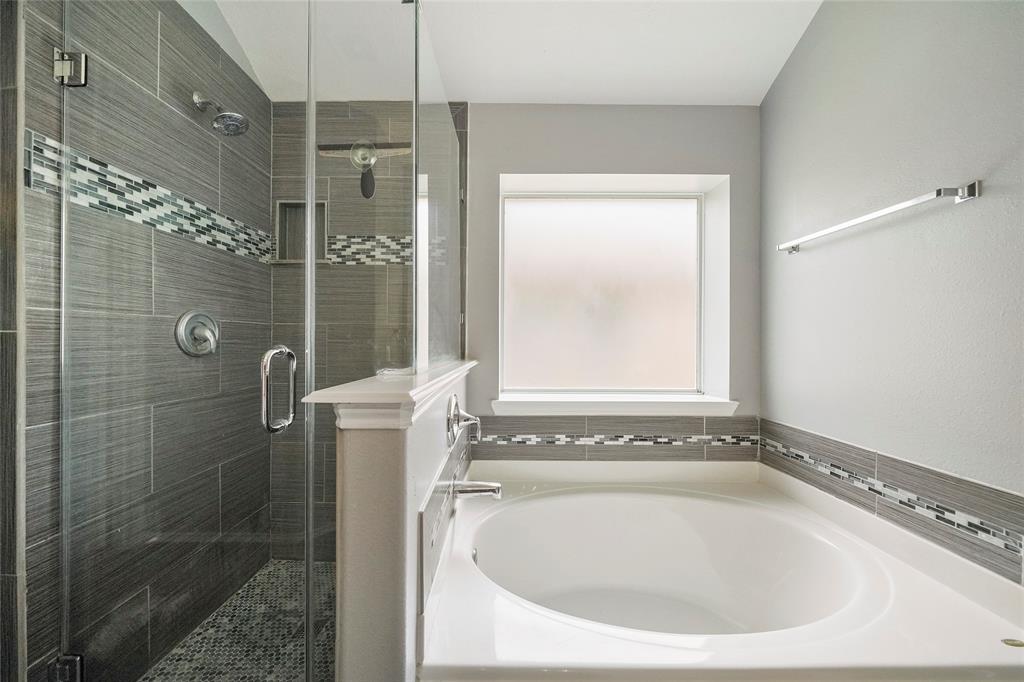
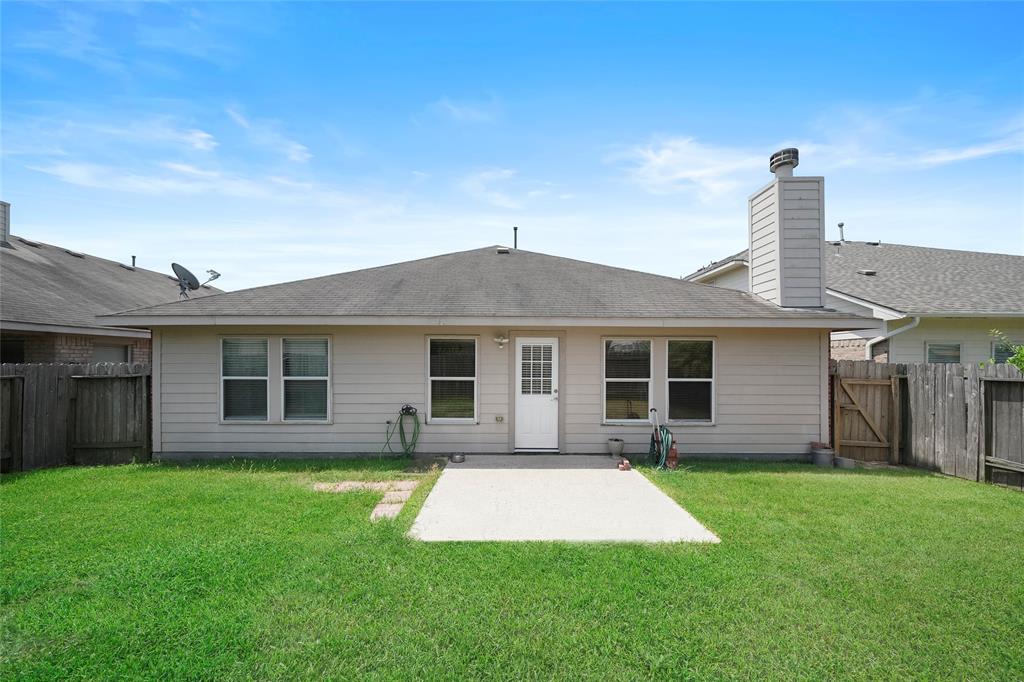
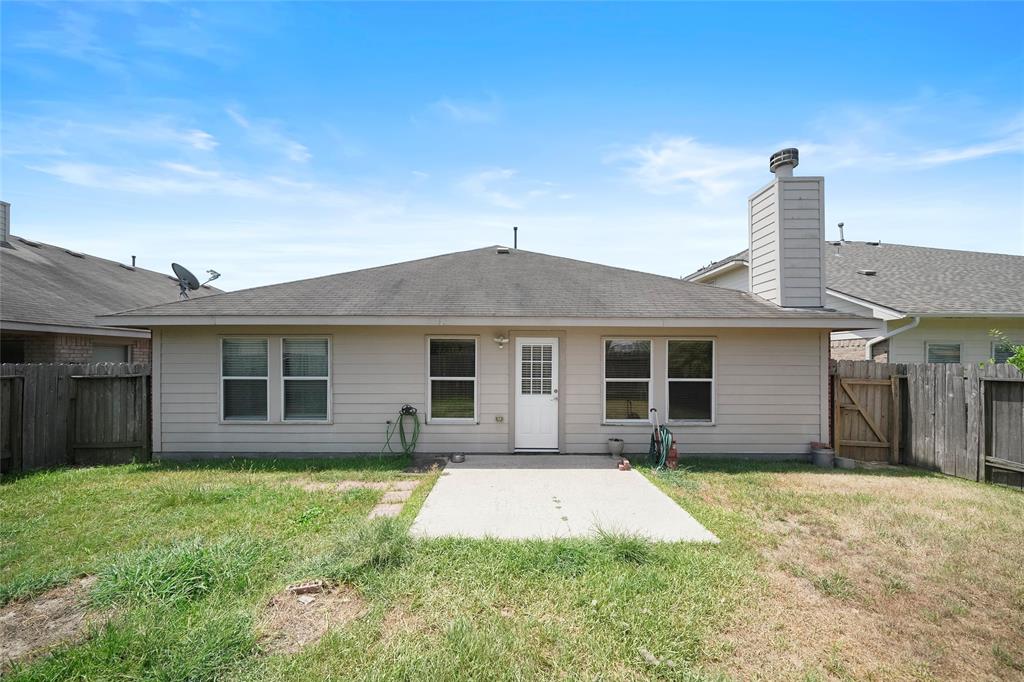
Hidden gem in the Falls at White Oak subdivision; Open floor plan with living room with cozy fireplace; New AC in 2021; Only 1 owner since built; Never flooded; This charming home is located in close proximity to major highways, restaurants, shopping & more; All measurements are approximate and should be independently verified.
Premium Content
Get full access to Premium Content
Sold Price for nearby listings,
Property History Reports and more.
Sign Up or
Log In Now
General Description
Sold Price Range:
$285,001 - $325,000
Address:
21322 Mission Falls Drive
Legal Description:
LT 87 BLK 2 FALLS AT WHITE OAK
Property Type:
Single-Family
Year Built:
2007 / Appraisal
Building Sqft.:
1,830 170(m²) /Appraisal District
Lot Size:
5,250 Sqft. 488(m²) /Appraisal District
Maintenance Fee:
$ 350 / Annually
Ready to sell your home?
If you are considering selling your home, you may find out how now. Request your home selling analysis featuring Recently Sold, Market Analysis, Home Valuations and Market Update.
GET STARTED
Room Dimension
Family Room:
20 x 12.5, 1st
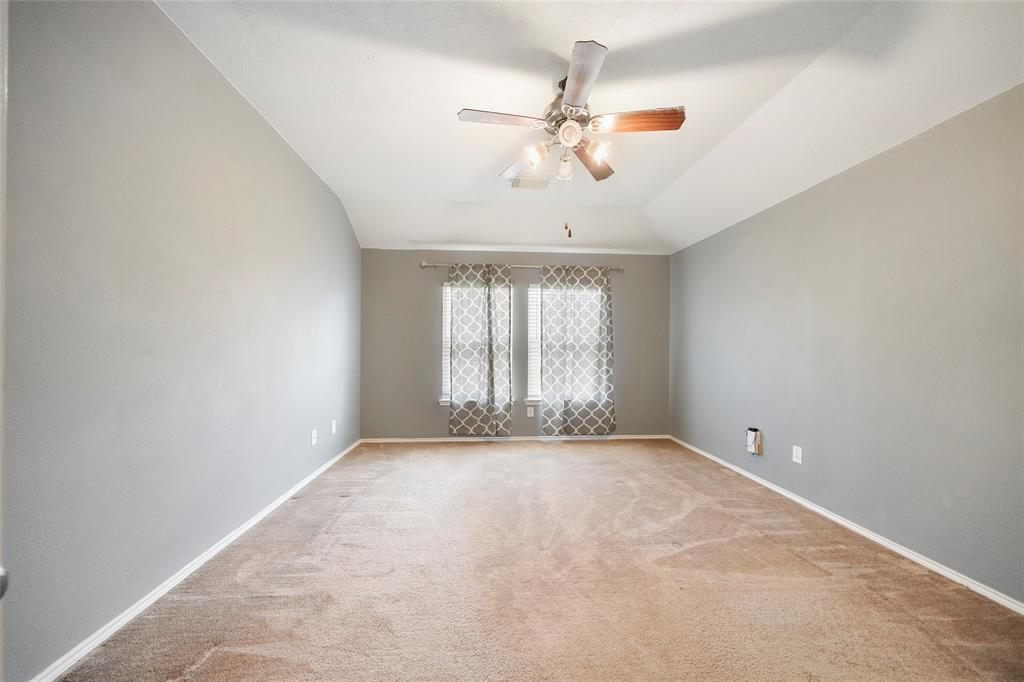
Primary Bedroom:
15.5 x 13, 1st
Interior Features
Room Description:
Family Room, Living/Dining Combo, Utility Room in House
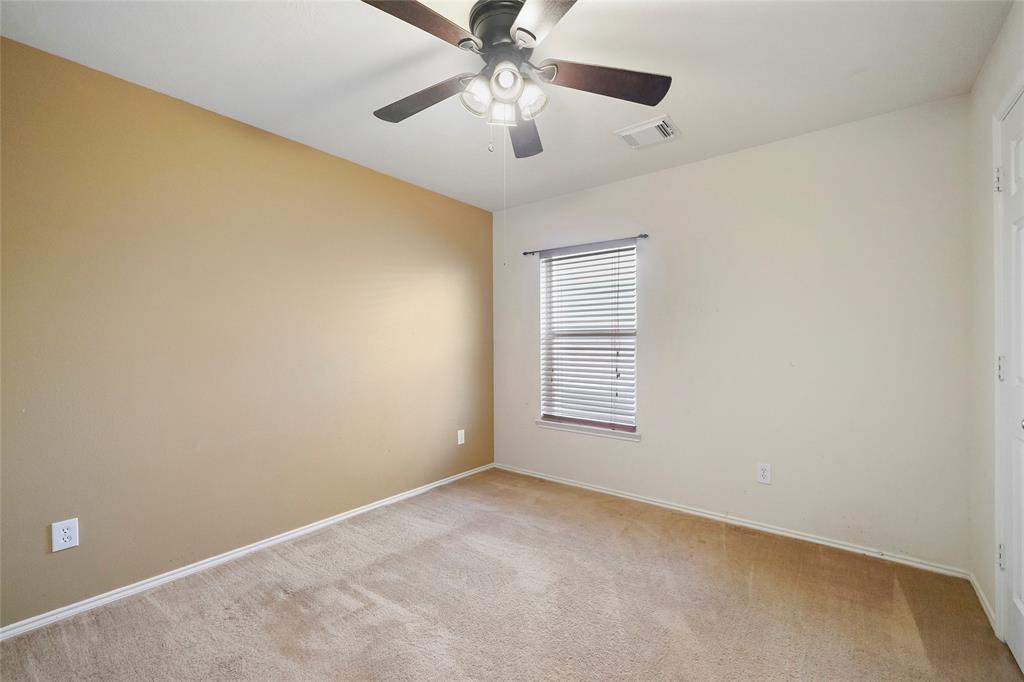
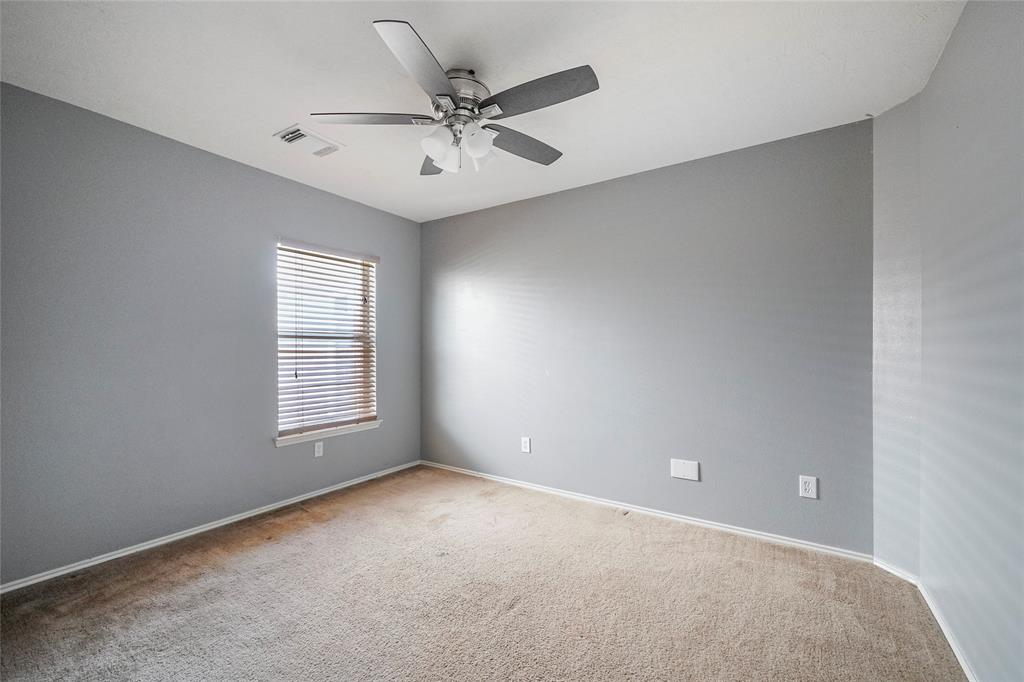
Bedroom Description:
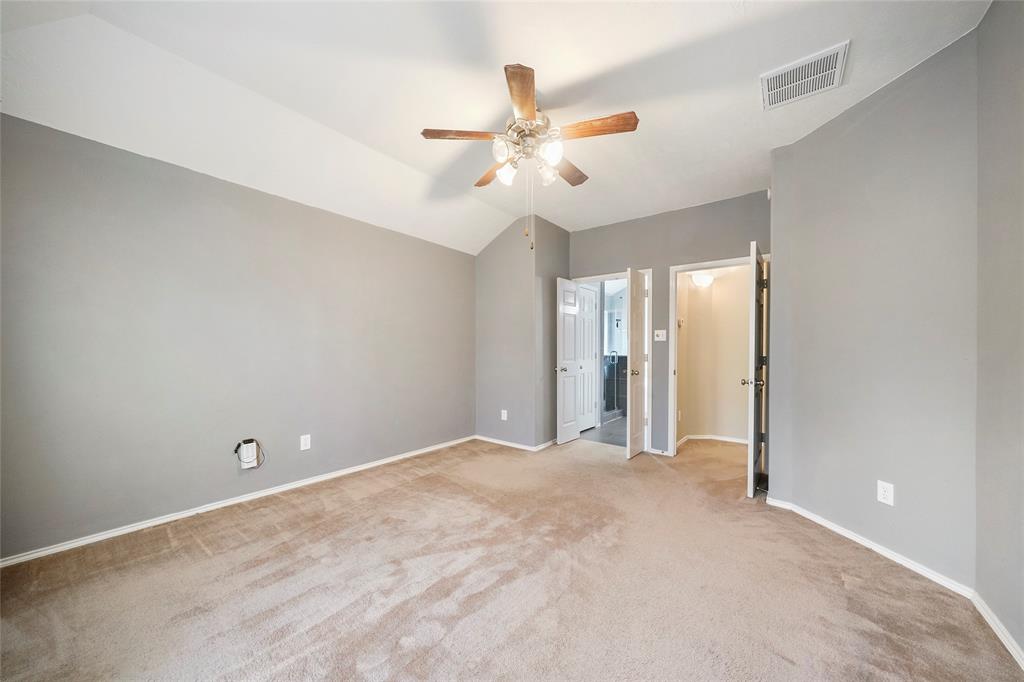
All Bedrooms Down, Walk-In Closet
Cooling:
Central Electric
Connections:
Electric Dryer Connections, Washer Connections
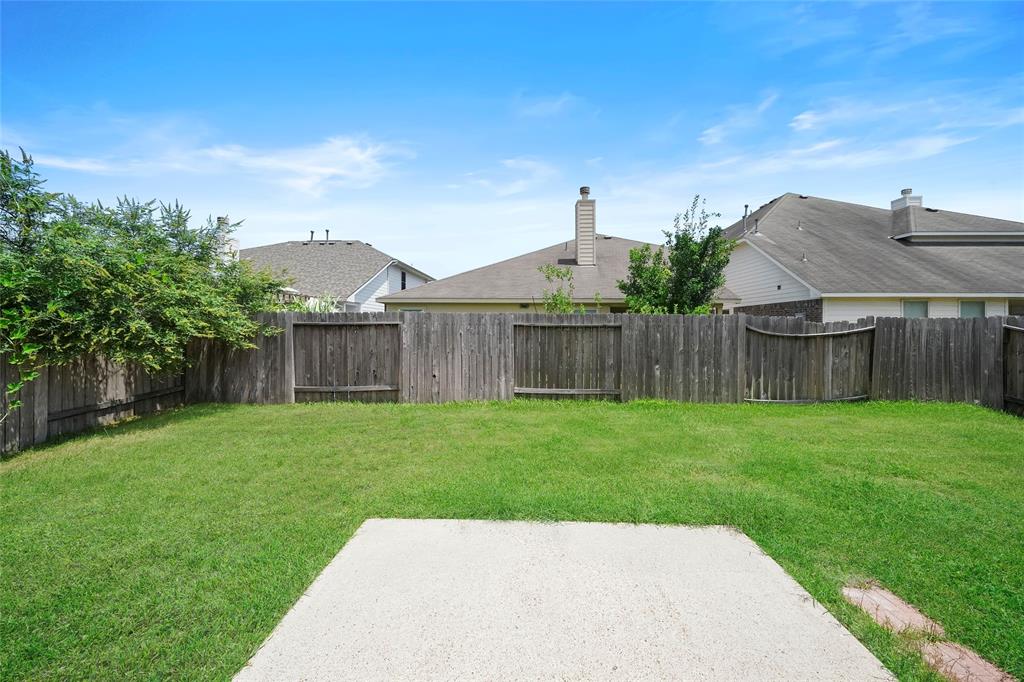
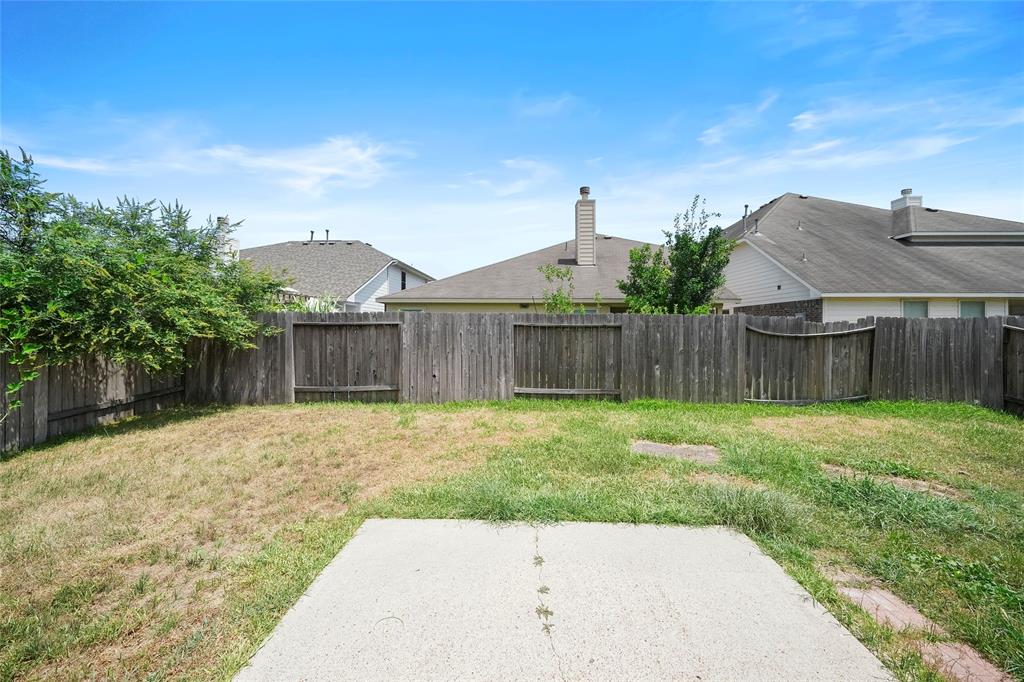
Exterior Features
Exterior Type:
Brick, Other
Lot Description:
Subdivision Lot
Garage Carport:
Double-Wide Driveway
Water Sewer:
Water District
Unit Location:
Subdivision Lot
Exterior:
Back Yard Fenced
Assigned School Information
School information is computer generated and may not be accurate or current. Buyer must independently verify and confirm enrollment. Please contact the school district to determine the schools to which this property is zoned.
Listing Broker: Keller Williams Metropolitan
Email Listing Broker
Selling Broker: RE/MAX Universal
Last updated as of: 07/16/2024
Property Tax
Market Value Per Appraisal District
Cost/Sqft based on Market Value
Tax Year
Cost/sqft
Market Value
Change
Tax Assessment
Change
2023
$164.50
$301,042
16.46% $301,042
33.88%
2022
$141.25
$258,496
22.15% $224,860
10.00%
2021
$115.64
$211,619
13.87% $204,419
10.00%
2020
$101.55
$185,836
0.67% $185,836
0.67%
2019
$100.87
$184,596
8.89% $184,596
8.89%
2018
$92.63
$169,521
0.00% $169,521
0.00%
2017
$92.63
$169,521
3.08% $169,521
3.08%
2016
$89.86
$164,449
1.53% $164,449
2.04%
2015
$88.51
$161,969
4.99% $161,167
10.00%
2014
$84.30
$154,277
15.83% $146,516
10.00%
2013
$72.79
$133,197
8.29% $133,197
8.29%
2012
$67.21
$123,000
$123,000
2023 Harris County Appraisal District Tax Value
Market Land Value:
$54,600
Market Improvement Value:
$246,442
Total Market Value : $301,042
2023 Tax Rates
CYPRESS-FAIRBANKS ISD:
1.0811 %
HARRIS COUNTY:
0.3501 %
HC FLOOD CONTROL DIST:
0.0311 %
PORT OF HOUSTON AUTHORITY:
0.0057 %
HC HOSPITAL DIST:
0.1434 %
HC DEPARTMENT OF EDUCATION:
0.0048 %
LONE STAR COLLEGE SYS:
0.1076 %
HC FWSD 61:
0.2600 %
HC EMERG SRV DIST 9:
0.0444 %
Total Tax Rate : 2.0282 %
 Welcome home!