Sold Price Range: $215,001 - $250,000
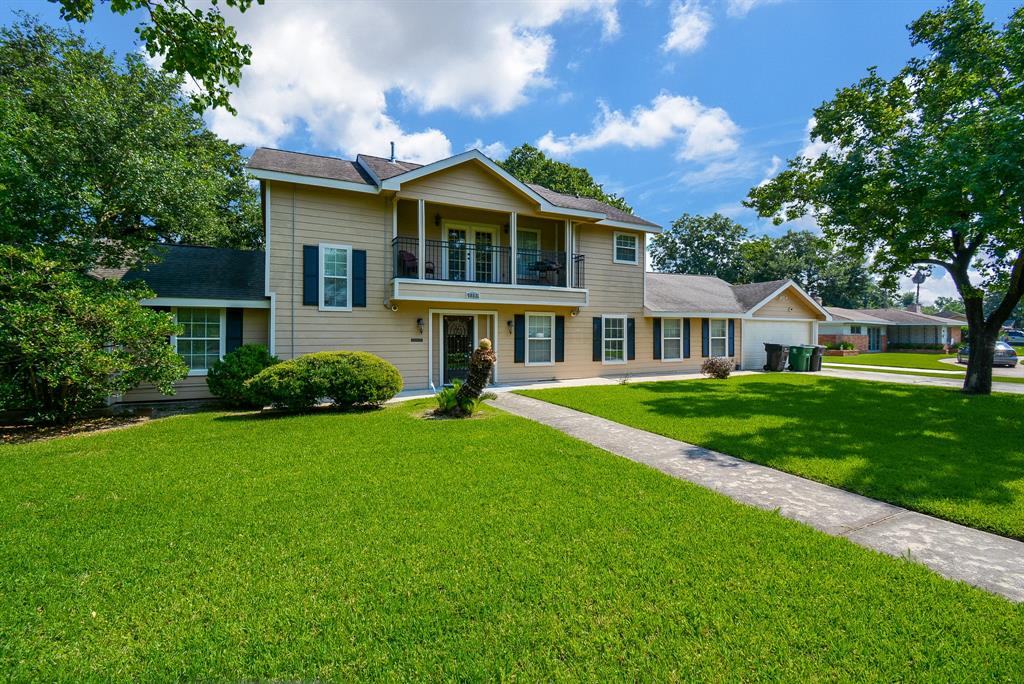
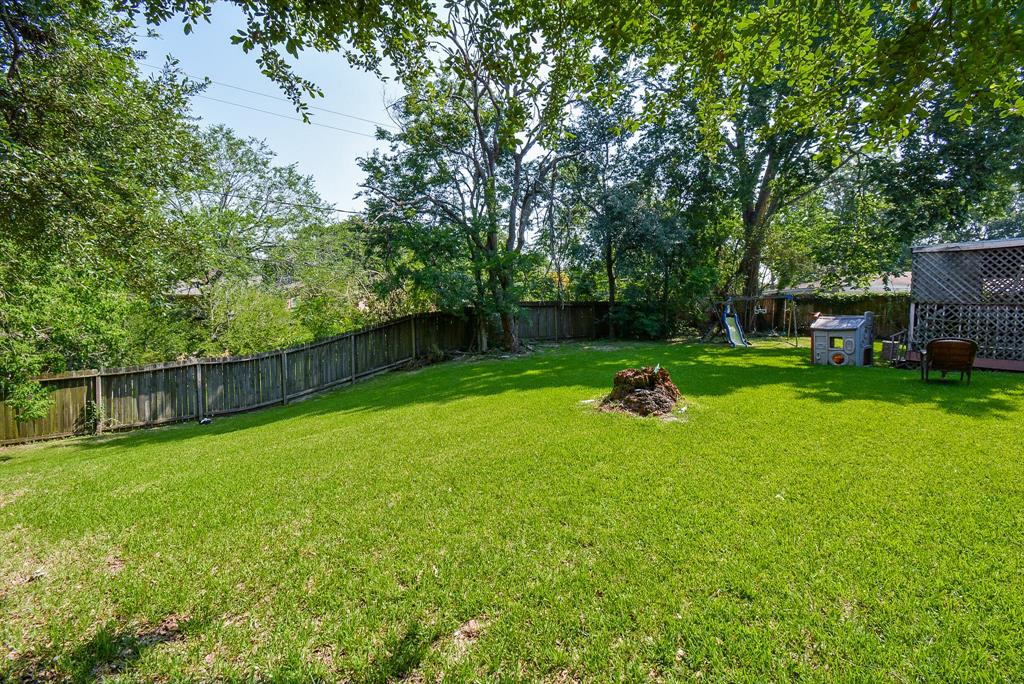
Spacious 2-story home poised on a large lot in deed restricted Glenbrook Valley, primary bedroom is located on the first floor, 2 additional bedrooms upstairs, dining area, large island kitchen- great for family gatherings! Sold as is, Big backyard features a large covered patio! Great location!
Premium Content
Get full access to Premium Content
Sold Price for nearby listings,
Property History Reports and more.
Sign Up or
Log In Now
General Description
Sold Price Range:
$215,001 - $250,000
Address:
7923 Glenview Drive
Legal Description:
LT 11 BLK 2 GLENBROOK VALLEY SEC 1
Property Type:
Single-Family
Bedrooms:
3 - 4 Bedroom(s)
Year Built:
1955 / Appraisal District
Building Sqft.:
2,836 263(m²) /Appraisal District
Lot Size:
13,088 Sqft. 1,216(m²) /Appraisal District
Ready to sell your home?
If you are considering selling your home, you may find out how now. Request your home selling analysis featuring Recently Sold, Market Analysis, Home Valuations and Market Update.
GET STARTED
Room Dimension
Primary Bedroom:
19 x 19, 1st
Home Office/Study:
12 x 7, 1st
Interior Features
Bathroom Description:
Primary Bath: Double Sinks
Bedroom Description:
Primary Bed - 1st Floor
Kitchen Description:
Breakfast Bar, Pantry
Room Description:
Family Room, Formal Dining, Formal Living, Living Area - 1st Floor, Utility Room in House
Cooling:
Central Electric
Exterior Features
Exterior Type:
Brick, Wood
Lot Description:
Subdivision Lot
Water Sewer:
Public Sewer, Public Water
Unit Location:
Subdivision Lot
Assigned School Information
School information is computer generated and may not be accurate or current. Buyer must independently verify and confirm enrollment. Please contact the school district to determine the schools to which this property is zoned.
Listing Broker: Carlos Garcia Realty
Email Listing Broker
Selling Broker: DOSS Pros LLC
Last updated as of: 06/29/2024
Property Tax
Market Value Per Appraisal District
Cost/Sqft based on Market Value
Tax Year
Cost/sqft
Market Value
Change
Tax Assessment
Change
2023
$140.91
$399,622
21.50% $399,622
21.50%
2022
$115.97
$328,895
18.99% $328,895
18.99%
2021
$97.46
$276,402
10.26% $276,402
10.26%
2020
$88.39
$250,686
4.38% $250,686
4.38%
2019
$84.69
$240,174
8.93% $240,174
8.93%
2018
$77.75
$220,488
4.85% $220,488
4.85%
2017
$74.15
$210,293
7.05% $210,293
7.05%
2016
$69.27
$196,438
0.00% $196,438
0.00%
2015
$69.27
$196,438
23.55% $196,438
23.55%
2014
$56.06
$159,000
6.00% $159,000
6.00%
2013
$52.89
$150,000
0.00% $150,000
0.00%
2012
$52.89
$150,000
$150,000
2023 Harris County Appraisal District Tax Value
Market Land Value:
$61,464
Market Improvement Value:
$338,158
Total Market Value : $399,622
2023 Tax Rates
HOUSTON ISD:
0.8683 %
HARRIS COUNTY:
0.3501 %
HC FLOOD CONTROL DIST:
0.0311 %
PORT OF HOUSTON AUTHORITY:
0.0057 %
HC HOSPITAL DIST:
0.1434 %
HC DEPARTMENT OF EDUCATION:
0.0048 %
HOUSTON COMMUNITY COLLEGE:
0.0922 %
HOUSTON CITY OF:
0.5192 %
HOBBY AREA DISTRICT:
0.1250 %
Total Tax Rate : 2.1398 %