Sold Price Range: $185,001 - $215,000
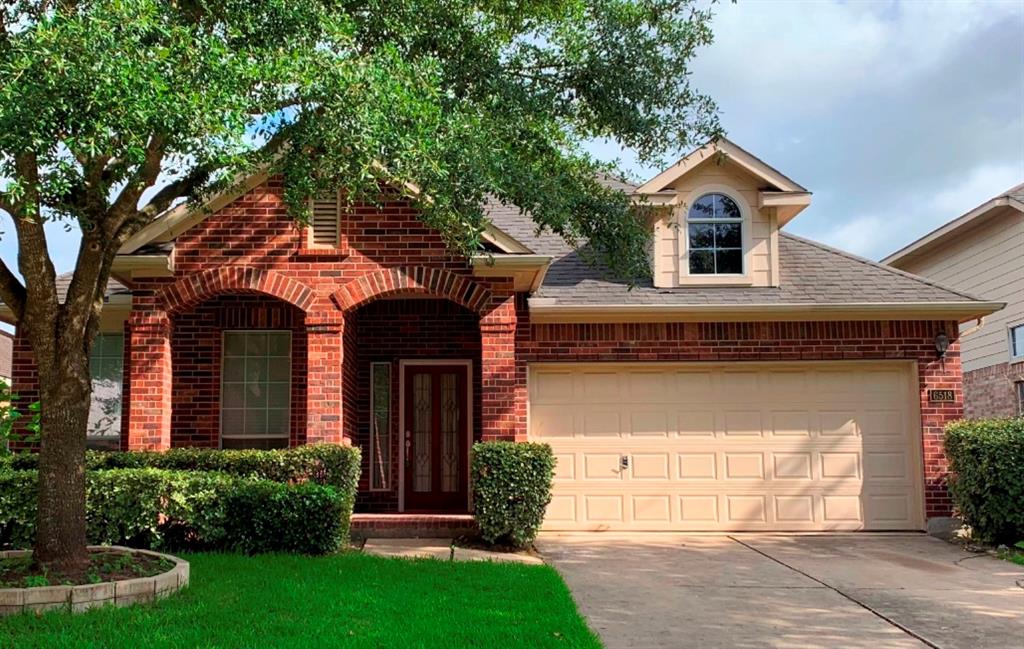
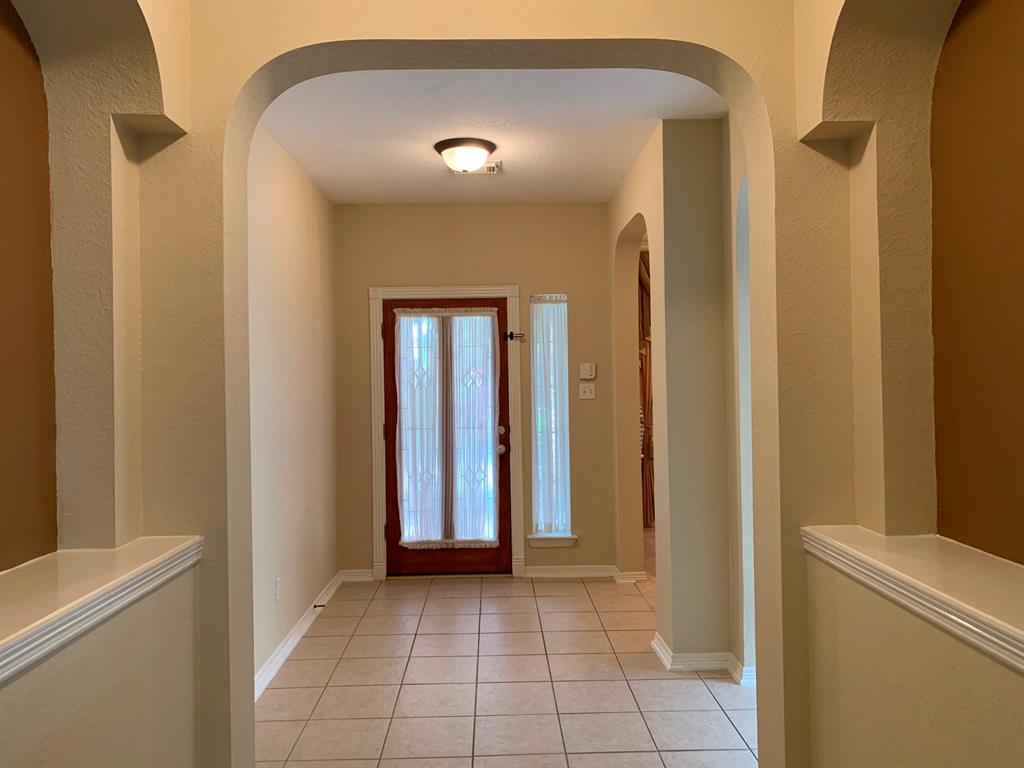
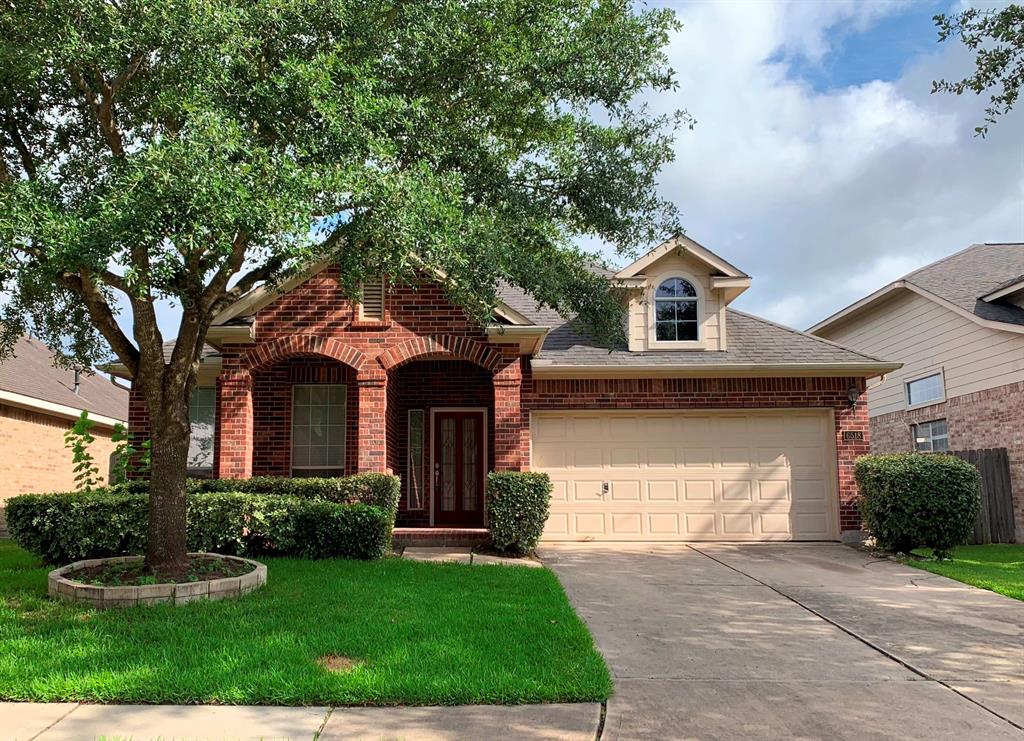
Charming one story home with spacious living area and corner fireplace. Open floor plan with 3 bedrooms. Formal Dining room. Kitchen opening into Den, pantry, and lots of counter space. Easy access to Beltway 8, SH249, Frwy290 and near to shopping. The community has pool and park!
Premium Content
Get full access to Premium Content
Sold Price for nearby listings,
Property History Reports and more.
Sign Up or
Log In Now
General Description
Sold Price Range:
$185,001 - $215,000
Address:
6518 Silky Moss Drive
Legal Description:
LT 9 BLK 2 SILVER OAK TRAILS SEC 1
Property Type:
Single-Family
Year Built:
2003 / Appraisal District
Building Sqft.:
1,883 175(m²) /Appraisal District
Lot Size:
5,750 Sqft. 534(m²) /Appraisal District
Maintenance Fee:
$ 675 / Annually
Ready to sell your home?
If you are considering selling your home, you may find out how now. Request your home selling analysis featuring Recently Sold, Market Analysis, Home Valuations and Market Update.
GET STARTED
Room Dimension
Primary Bedroom:
12 x 13, 1st
Interior Features
Number Of Dinning Area:
1 Living Area, Breakfast Room, Formal Dining
Room Description:
1 Living Area, Breakfast Room, Formal Dining
Bedroom Description:
All Bedrooms Down
Bathroom Description:
Double Sinks, Primary Bath + Separate Shower
Cooling:
Central Electric
Exterior Features
Exterior Type:
Brick Veneer
Lot Description:
Subdivision Lot
Water Sewer:
Public Sewer, Water District
Unit Location:
Subdivision Lot
Assigned School Information
School information is computer generated and may not be accurate or current. Buyer must independently verify and confirm enrollment. Please contact the school district to determine the schools to which this property is zoned.
Listing Broker: LV Realty & Services
Email Listing Broker
Selling Broker: RE/MAX Partners
Last updated as of: 07/17/2024
Property Tax
Market Value Per Appraisal District
Cost/Sqft based on Market Value
Tax Year
Cost/sqft
Market Value
Change
Tax Assessment
Change
2023
$142.30
$267,945
4.25% $267,945
4.25%
2022
$136.50
$257,024
27.21% $257,024
27.21%
2021
$107.30
$202,053
1.40% $202,053
1.40%
2020
$105.83
$199,273
9.33% $199,273
9.33%
2019
$96.80
$182,273
6.42% $182,273
6.42%
2018
$90.96
$171,281
-1.73% $171,281
-1.73%
2017
$92.56
$174,293
6.72% $174,293
6.72%
2016
$86.73
$163,312
3.51% $163,312
3.51%
2015
$83.79
$157,776
12.31% $157,776
12.31%
2014
$74.61
$140,486
7.33% $140,486
7.33%
2013
$69.51
$130,893
0.00% $130,893
0.00%
2012
$69.51
$130,893
$130,893
2023 Harris County Appraisal District Tax Value
Market Land Value:
$60,950
Market Improvement Value:
$206,995
Total Market Value : $267,945
2023 Tax Rates
CYPRESS-FAIRBANKS ISD:
1.0811 %
HARRIS COUNTY:
0.3501 %
HC FLOOD CONTROL DIST:
0.0311 %
PORT OF HOUSTON AUTHORITY:
0.0057 %
HC HOSPITAL DIST:
0.1434 %
HC DEPARTMENT OF EDUCATION:
0.0048 %
LONE STAR COLLEGE SYS:
0.1076 %
HC EMERG SRV DIST 13:
0.0919 %
NORTHWEST PARK MUD:
0.3780 %
Total Tax Rate : 2.1936 %