Sold Price Range: $285,001 - $325,000
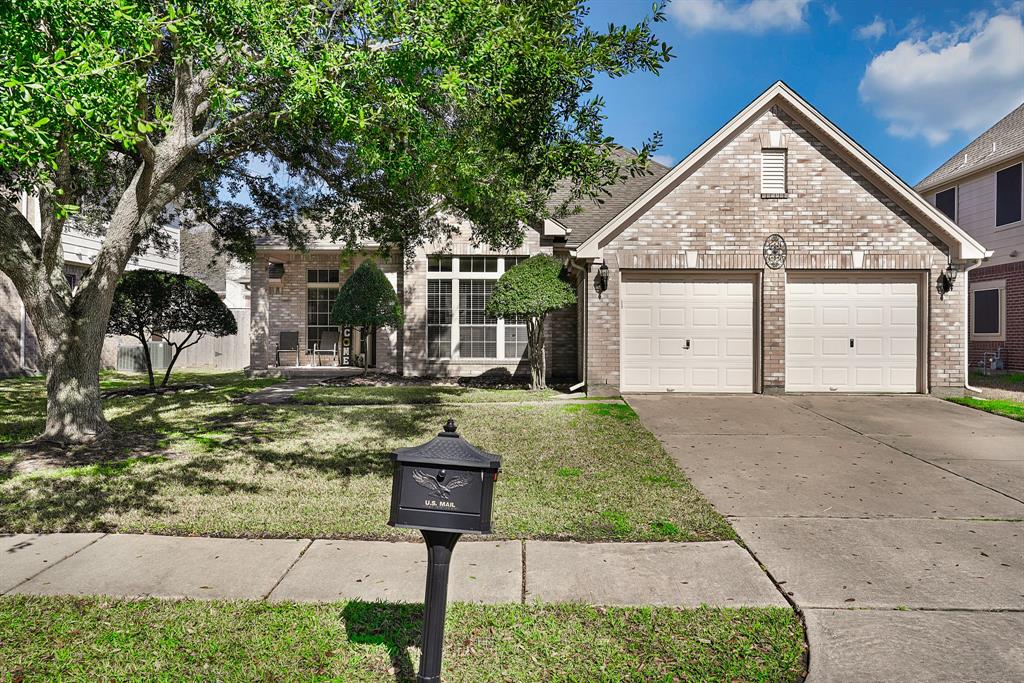
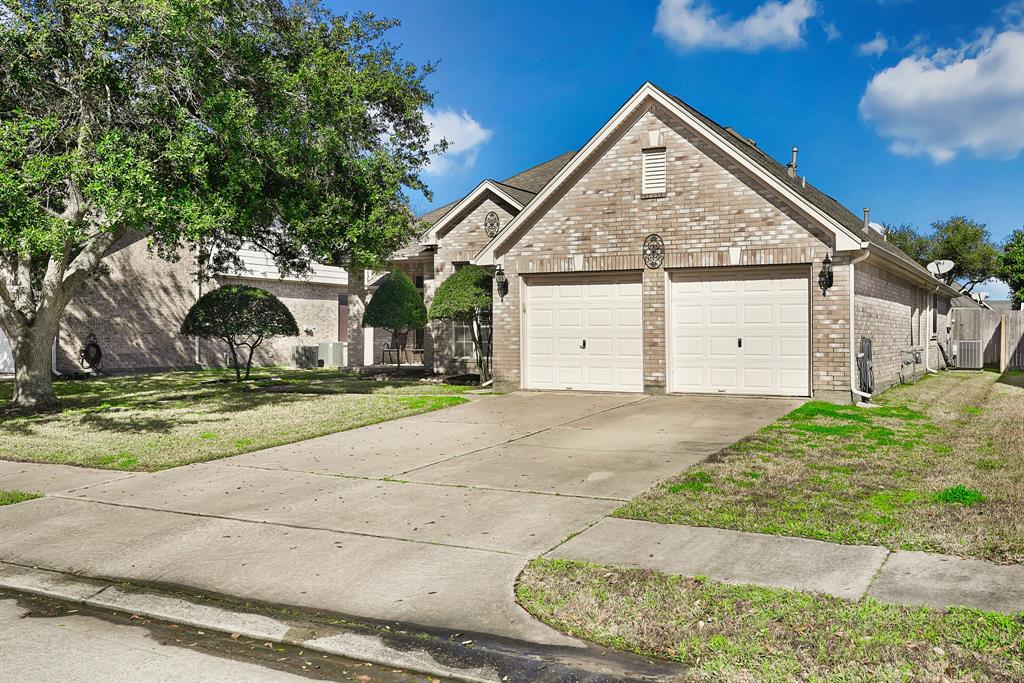
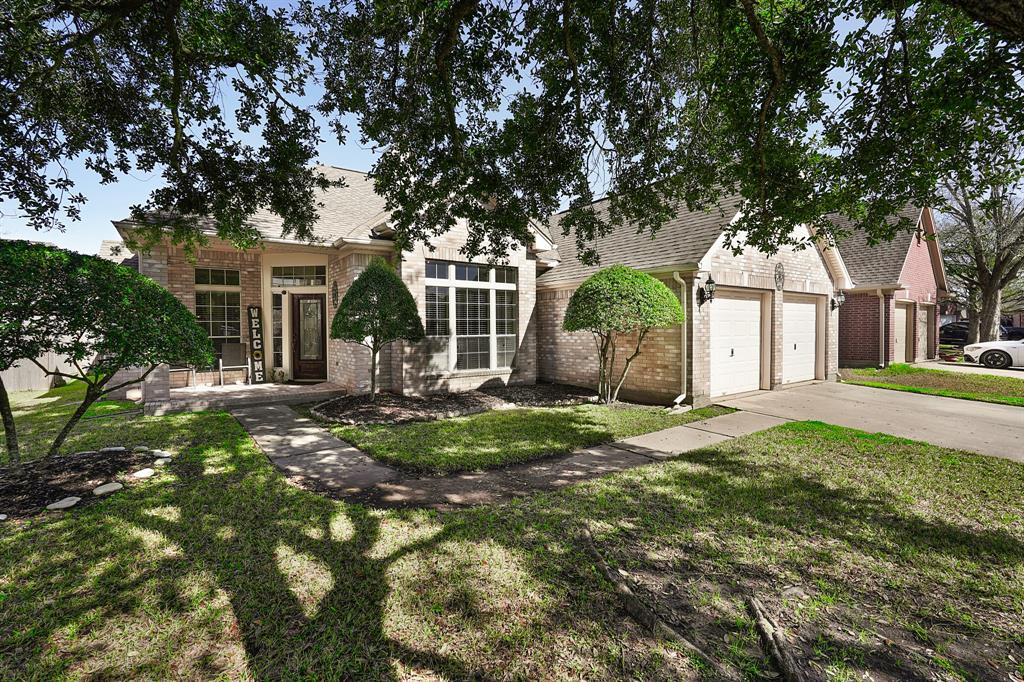
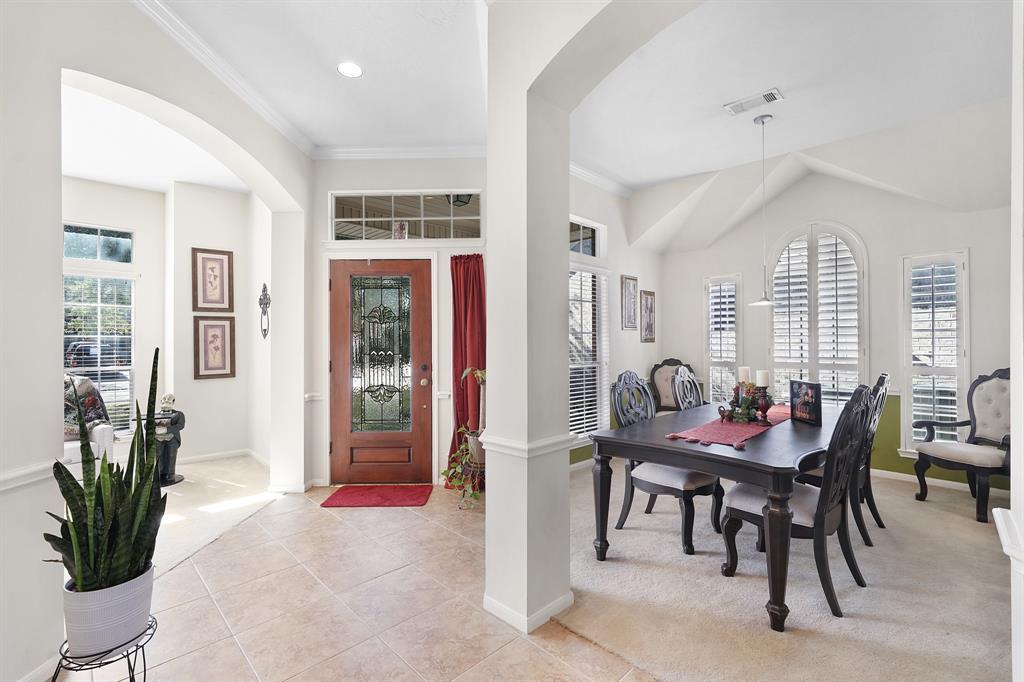
This pristine residence offers a perfect blend of comfort and style, providing an ideal setting for both relaxation and entertaining. Easy commutes to schools, shopping, restaurants and medical facilities. This quiet established neighborhood is close to plenty recreational activities. Easy access to 225 and Bay Area Blvd. New HVAC in 2021.
Premium Content
Get full access to Premium Content
Sold Price for nearby listings,
Property History Reports and more.
Sign Up or
Log In Now
General Description
Sold Price Range:
$285,001 - $325,000
Address:
10911 Sycamore Dr S
Legal Description:
LT 13 BLK 38 FAIRMONT PK EAST SEC 4 PH 4-B
Property Type:
Single-Family
Year Built:
1998 / Appraisal District
Building Sqft.:
1,983 184(m²) /Appraisal District
Lot Size:
6,600 Sqft. 613(m²) /Appraisal District
Maintenance Fee:
$ 300 / Annually
Ready to sell your home?
If you are considering selling your home, you may find out how now. Request your home selling analysis featuring Recently Sold, Market Analysis, Home Valuations and Market Update.
GET STARTED
Room Dimension
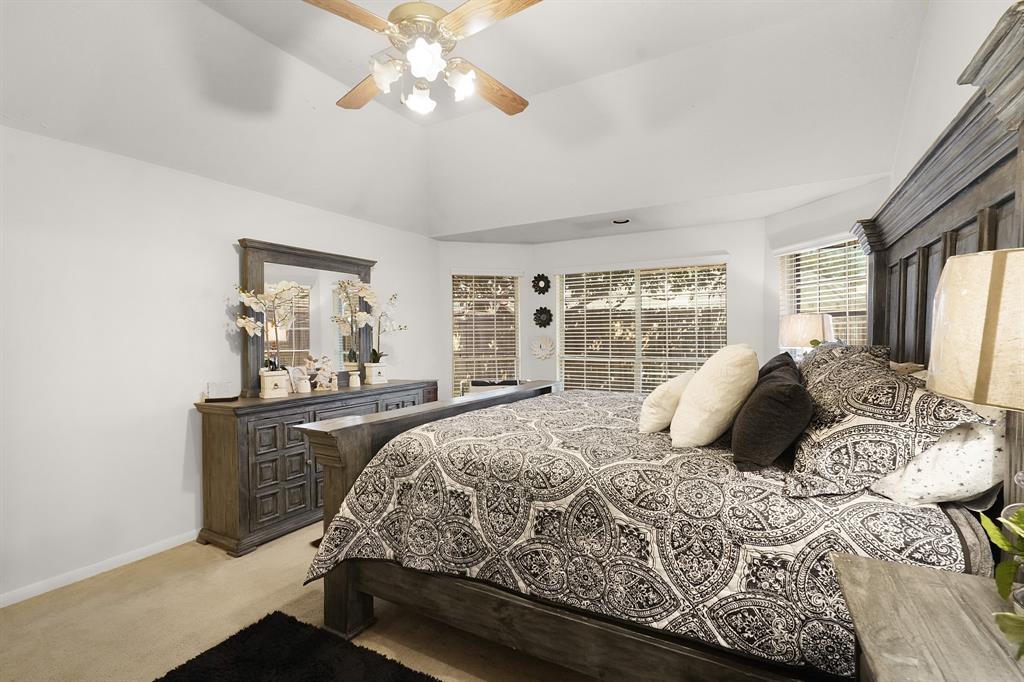
Primary Bedroom:
18x13, 1st
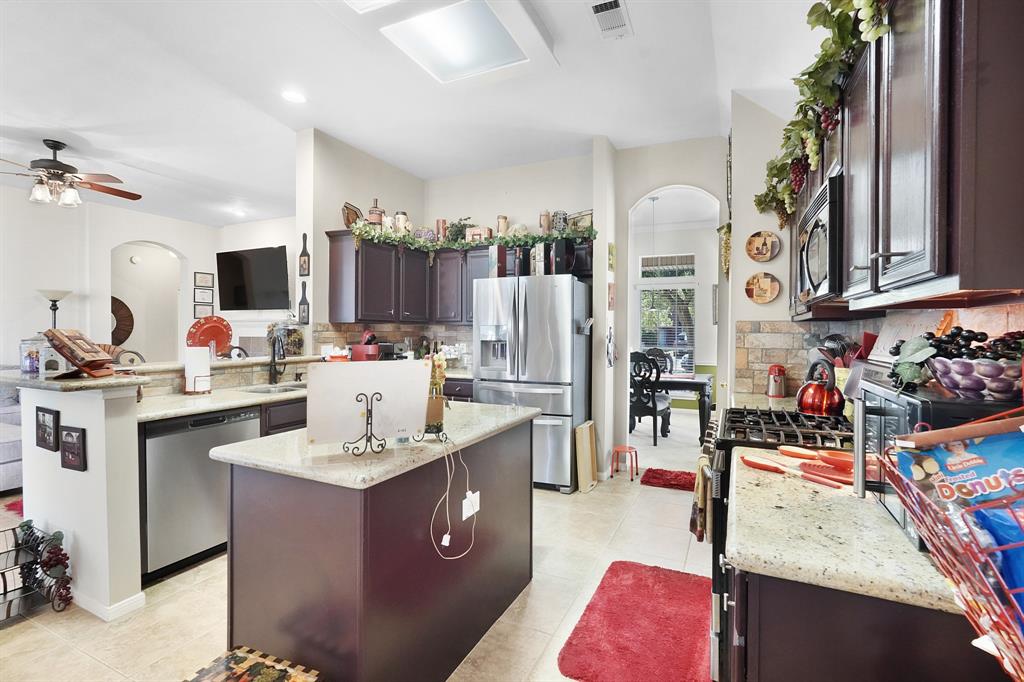
Interior Features
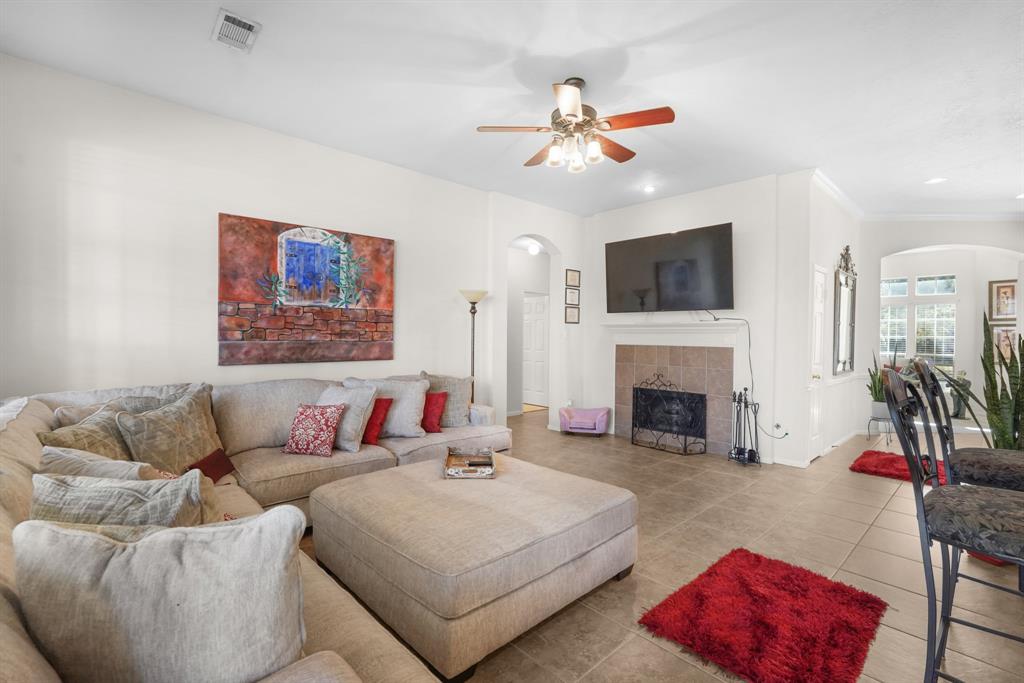
Fireplace:
1/Gas Connections
Room Description:
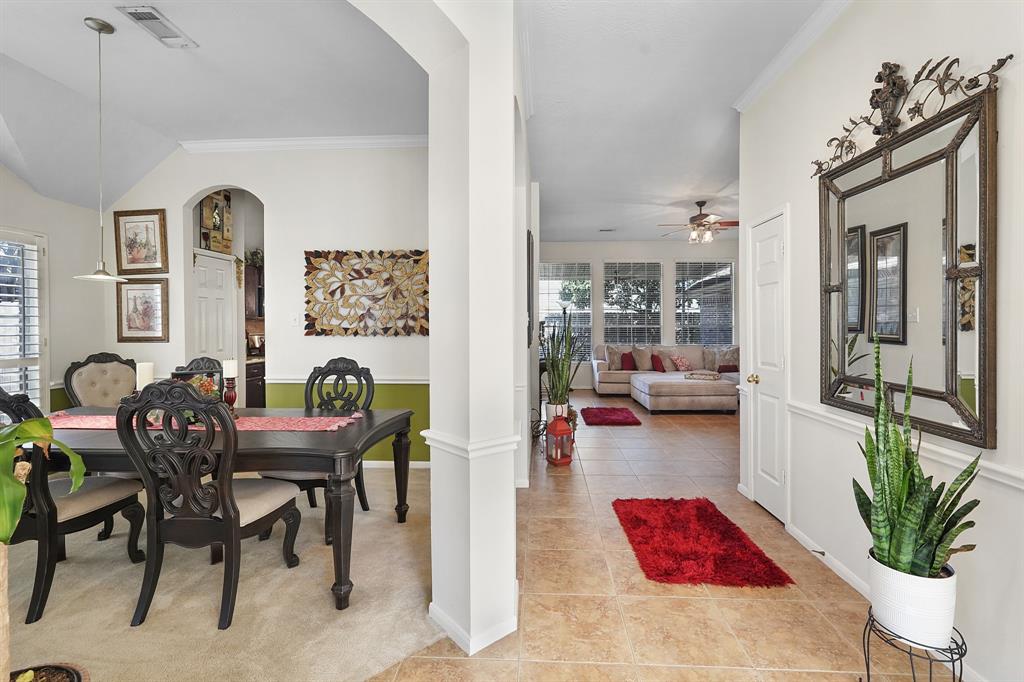
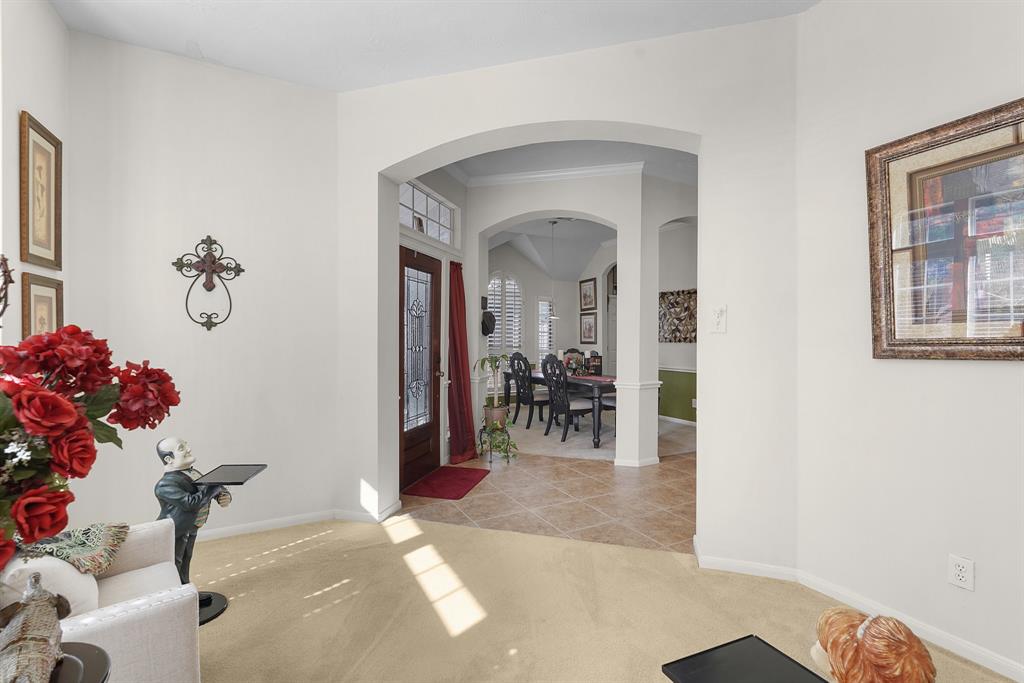
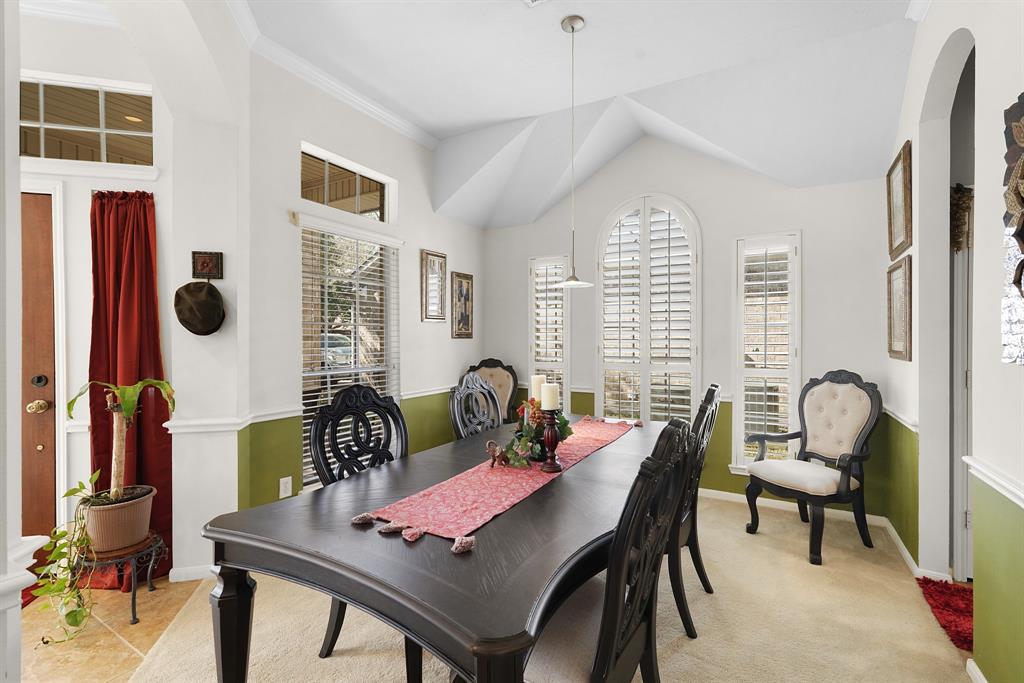
Formal Dining, Formal Living, Kitchen/Dining Combo, Home Office/Study
Kitchen Description:
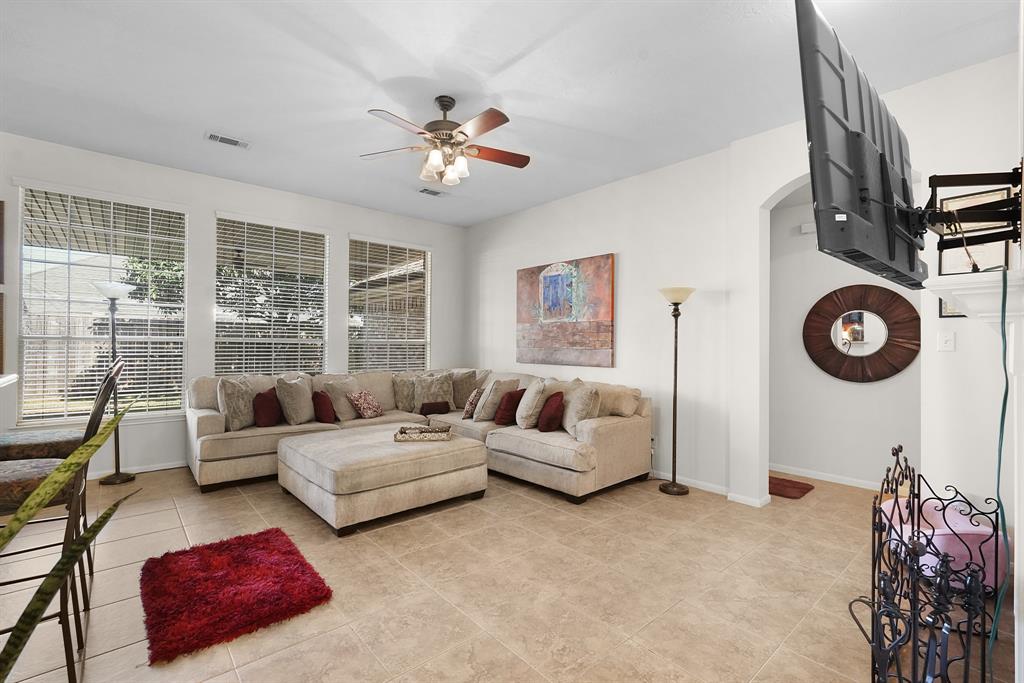
Breakfast Bar, Kitchen open to Family Room
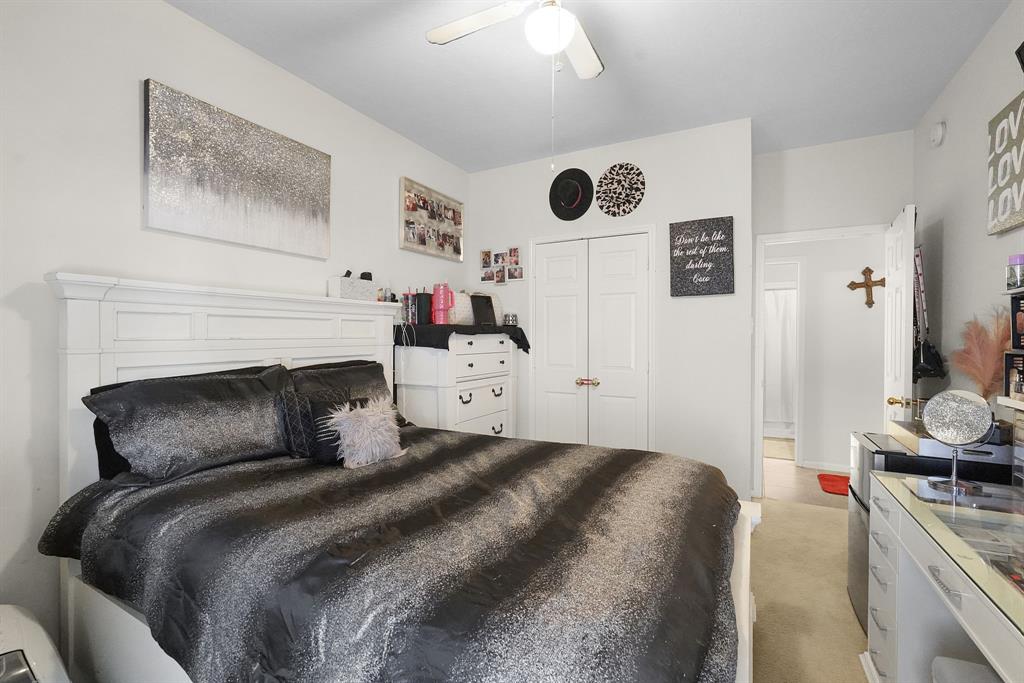
Bedroom Description:
All Bedrooms Down
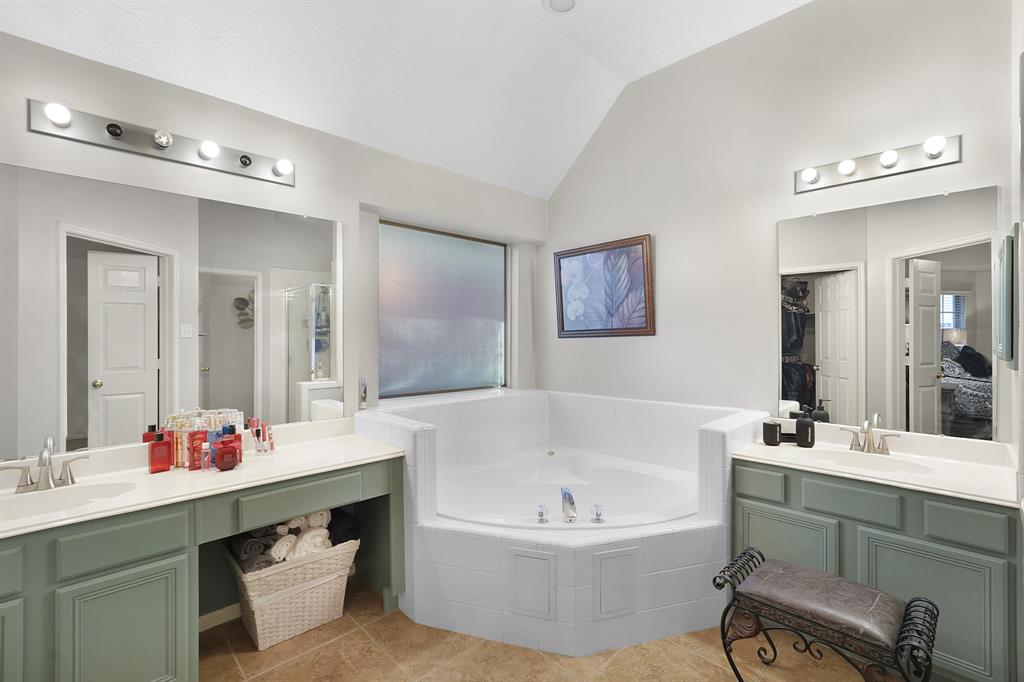
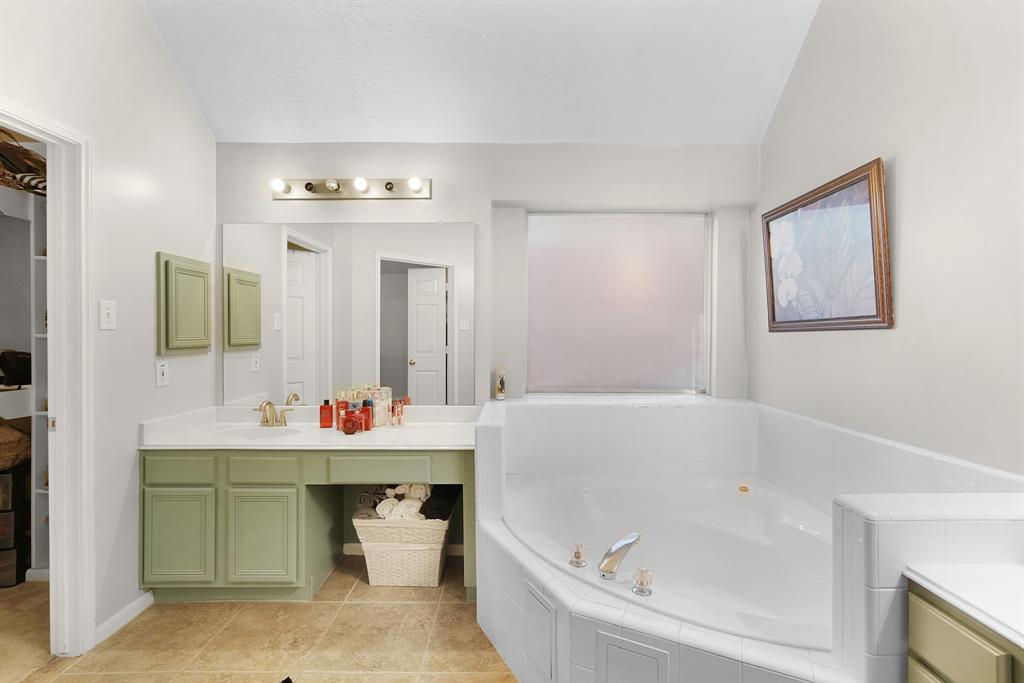
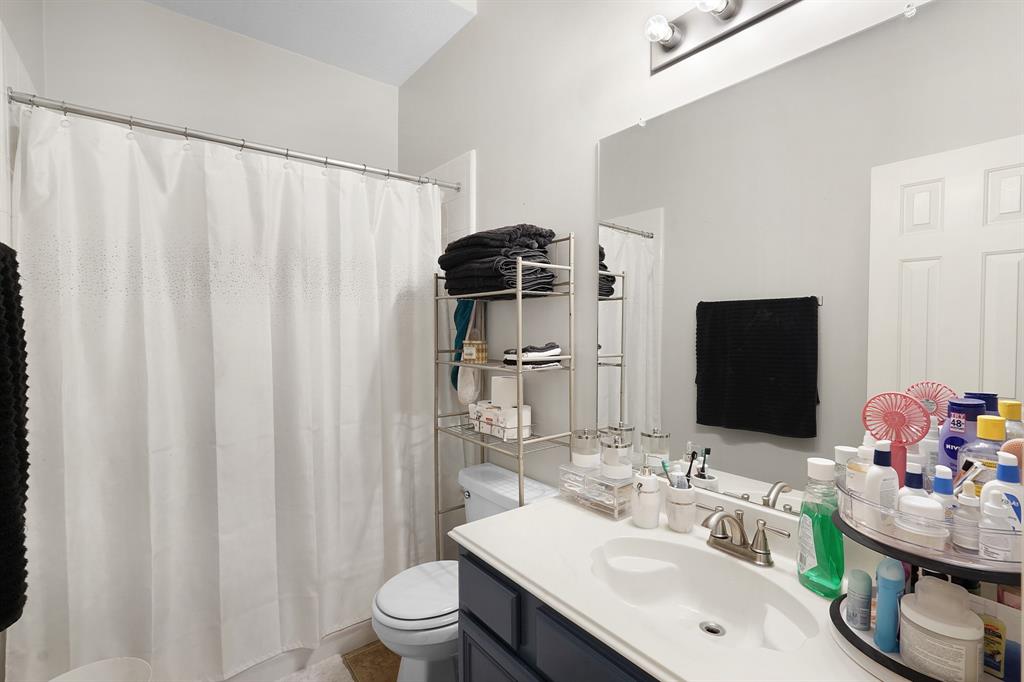
Bathroom Description:
Primary Bath: Double Sinks
Cooling:
Central Electric
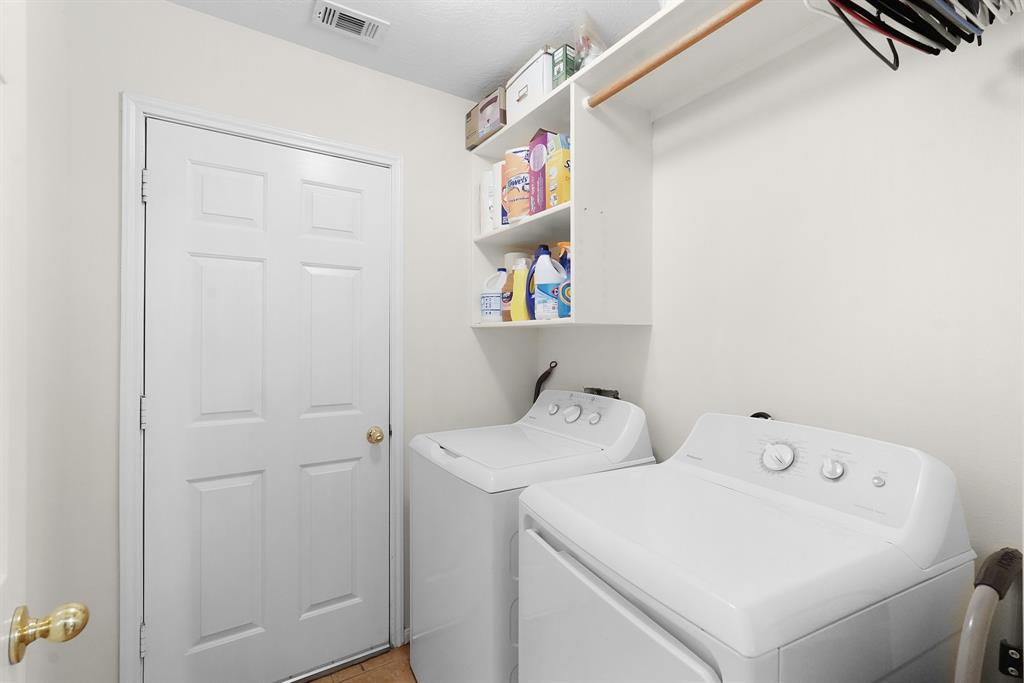
Connections:
Gas Dryer Connections
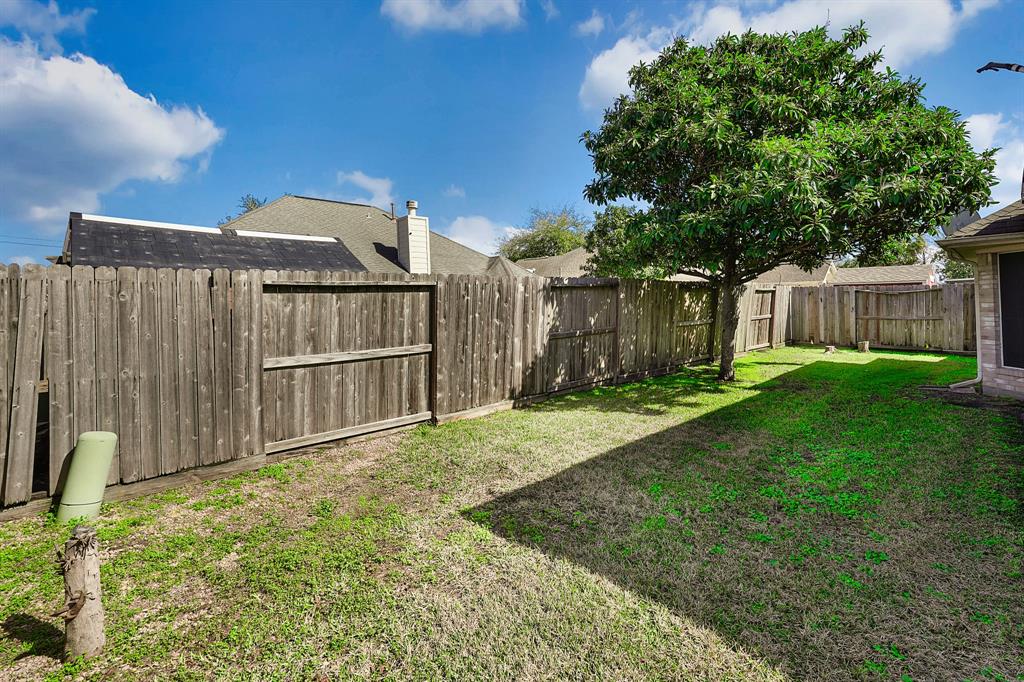
Exterior Features
Lot Description:
Subdivision Lot
Water Sewer:
Public Sewer, Public Water
Exterior:
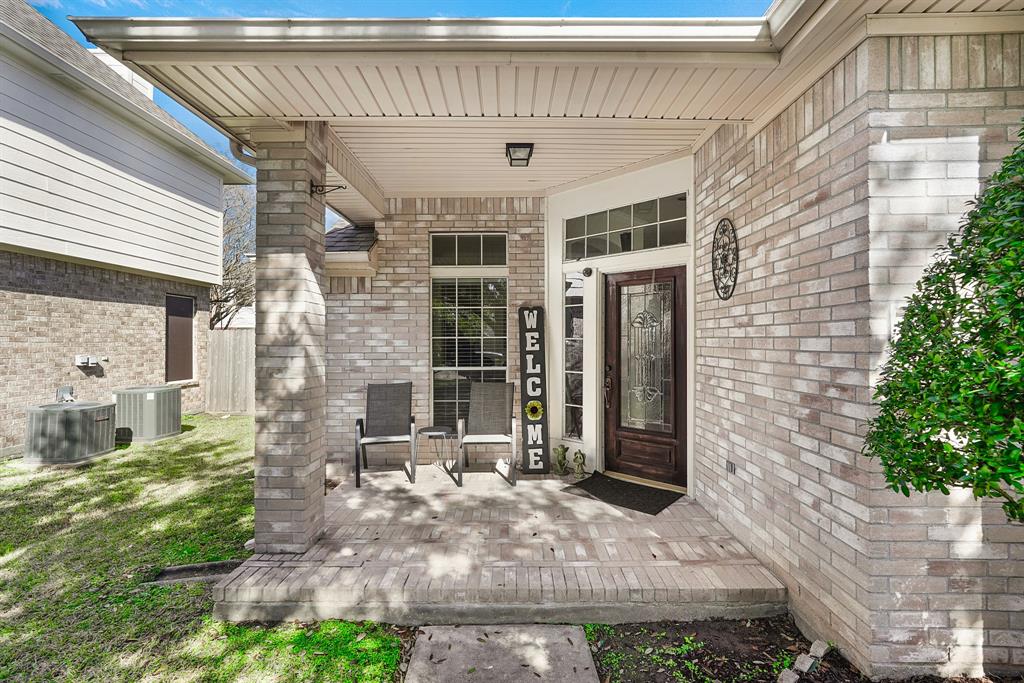
Back Yard, Back Yard Fenced, Covered Patio/Deck, Porch, Partially Fenced
Assigned School Information
School information is computer generated and may not be accurate or current. Buyer must independently verify and confirm enrollment. Please contact the school district to determine the schools to which this property is zoned.
Listing Broker: Thompson & Associates
Email Listing Broker
Selling Broker: AEA Realty, LLC
Last updated as of: 06/28/2024
Property Tax
Market Value Per Appraisal District
Cost/Sqft based on Market Value
Tax Year
Cost/sqft
Market Value
Change
Tax Assessment
Change
2023
$155.09
$307,546
12.78% $307,546
14.36%
2022
$137.52
$272,693
11.54% $268,931
10.00%
2021
$123.29
$244,483
4.52% $244,483
4.52%
2020
$117.96
$233,920
5.39% $233,920
5.39%
2019
$111.93
$221,967
6.57% $221,967
6.57%
2018
$105.04
$208,291
0.00% $208,291
0.00%
2017
$105.04
$208,291
2.53% $208,291
3.22%
2016
$102.45
$203,149
10.74% $201,784
10.00%
2015
$92.51
$183,440
8.60% $183,440
8.60%
2014
$85.18
$168,913
12.93% $168,913
12.93%
2013
$75.43
$149,576
0.00% $149,576
0.00%
2012
$75.43
$149,576
$149,576
2023 Harris County Appraisal District Tax Value
Market Land Value:
$56,100
Market Improvement Value:
$251,446
Total Market Value : $307,546
2023 Tax Rates
LA PORTE ISD:
0.9739 %
HARRIS COUNTY:
0.3501 %
HC FLOOD CONTROL DIST:
0.0311 %
PORT OF HOUSTON AUTHORITY:
0.0057 %
HC HOSPITAL DIST:
0.1434 %
HC DEPARTMENT OF EDUCATION:
0.0048 %
SAN JACINTO COM COL D:
0.1462 %
LA PORTE CITY OF:
0.7100 %
Total Tax Rate : 2.3652 %