Sold Price Range: $325,001 - $370,000
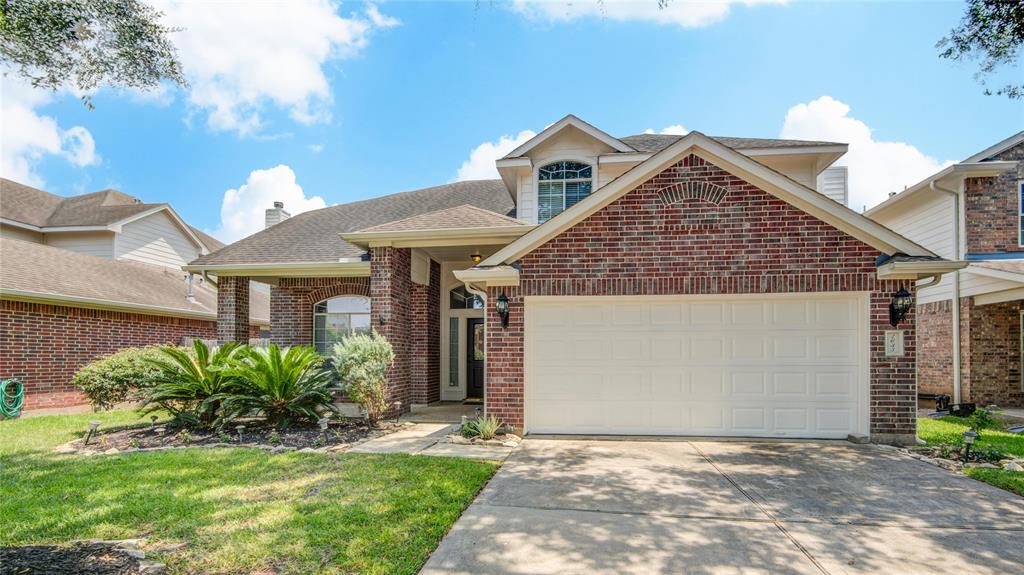
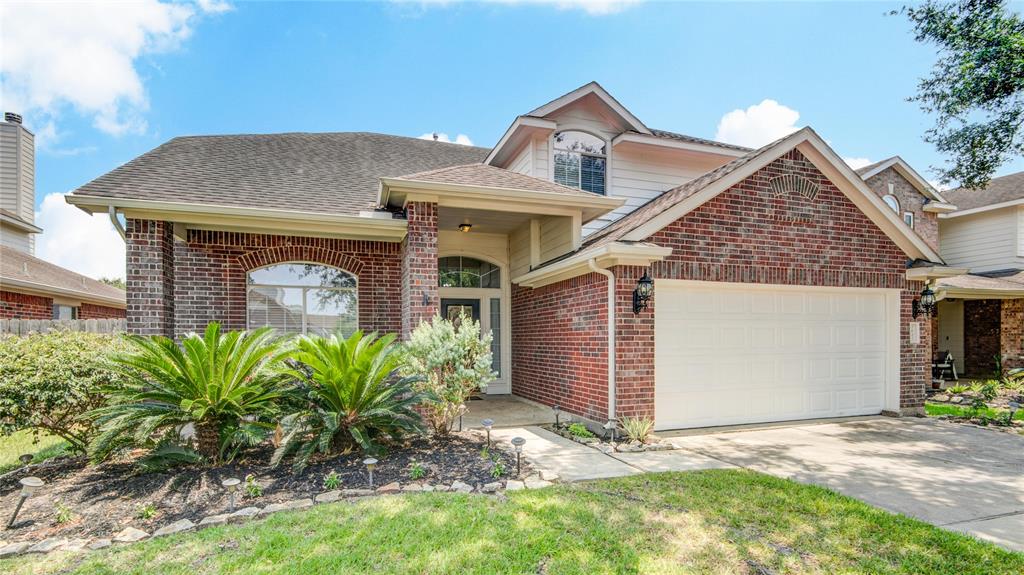
Welcome home!! This beautiful well maintained 4 bedroom 3 bath home is ready for a new owner. This home features updated appliances and kitchen, freshly painted walls, new fixtures and lighting. Conveniently located in well sought after Parkway Oaks subdivision. Easy access to Grand Parkway 99, Westpark Tollway and I-10, Schedule your private tour today.
Premium Content
Get full access to Premium Content
Sold Price for nearby listings,
Property History Reports and more.
Sign Up or
Log In Now
General Description
Sold Price Range:
$325,001 - $370,000
Address:
2635 Sable Ridge Ln
Legal Description:
PARKWAY OAKS SEC 2, BLOCK 4, LOT 14
Property Type:
Single-Family
Baths:
2 Full & 1 Half Bath(s)
Year Built:
2004 / Builder
Building Sqft.:
2,321 216(m²) /Builder
Lot Size:
5,980 Sqft. 556(m²) /Other
Maintenance Fee:
$ 750 / Annually
Ready to sell your home?
If you are considering selling your home, you may find out how now. Request your home selling analysis featuring Recently Sold, Market Analysis, Home Valuations and Market Update.
GET STARTED
Room Dimension
Primary Bedroom:
16x14, 1st
Interior Features
Cooling:
Central Electric
Exterior Features
Lot Description:
Subdivision Lot
Water Sewer:
Public Sewer
Assigned School Information
School information is computer generated and may not be accurate or current. Buyer must independently verify and confirm enrollment. Please contact the school district to determine the schools to which this property is zoned.
Listing Broker: Tanesha Royal-Spear, Broker
Email Listing Broker
Selling Broker: Walzel Properties - Corporate Office
Last updated as of: 07/06/2024
Property Tax
Market Value Per Appraisal District
Cost/Sqft based on Market Value
Tax Year
Cost/sqft
Market Value
Change
Tax Assessment
Change
2023
$150.77
$349,940
13.05% $283,250
10.00%
2022
$133.37
$309,550
32.24% $257,500
10.00%
2021
$100.86
$234,090
3.85% $234,090
3.85%
2020
$97.12
$225,420
-1.04% $225,420
-1.04%
2019
$98.14
$227,790
1.91% $227,790
1.91%
2018
$96.30
$223,510
2.22% $223,510
2.22%
2017
$94.21
$218,660
-1.44% $218,660
1.12%
2016
$95.59
$221,860
5.71% $216,240
10.00%
2015
$90.43
$209,880
17.44% $196,580
10.00%
2014
$77.00
$178,710
12.47% $178,710
12.47%
2013
$68.46
$158,890
$158,890
2023 Fort Bend County Appraisal District Tax Value
Market Land Value:
$30,000
Market Improvement Value:
$319,940
Total Market Value : $349,940
2023 Tax Rates
HARRIS-FT BEND MUD 1:
0.5600 %
KATY ISD:
1.1194 %
FT BEND CO GEN:
0.4265 %
FORT BEND DRNG:
0.0124 %
FT BEND CO ESD 2:
0.0918 %
WILLOW FORK DRNG:
0.1600 %
Total Tax Rate : 2.3701 %