Sold Price Range: $140,001 - $160,000
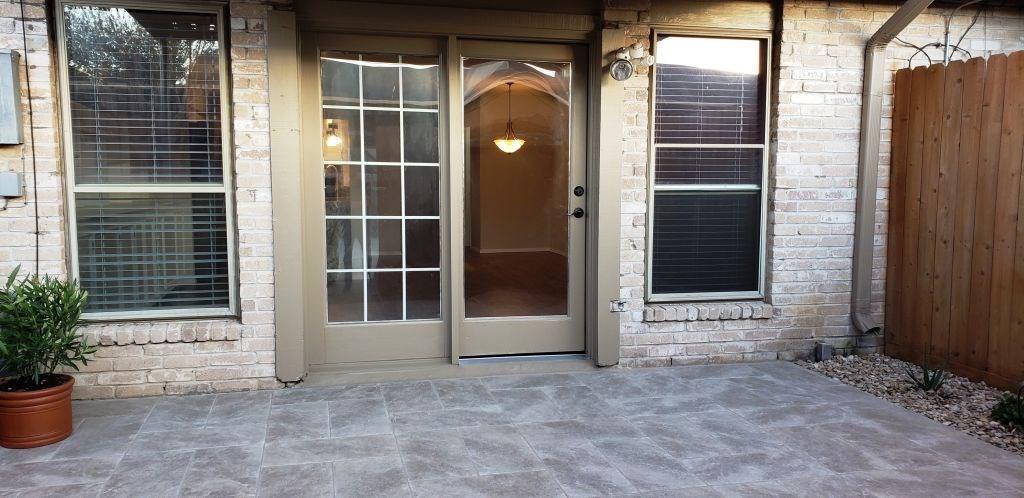
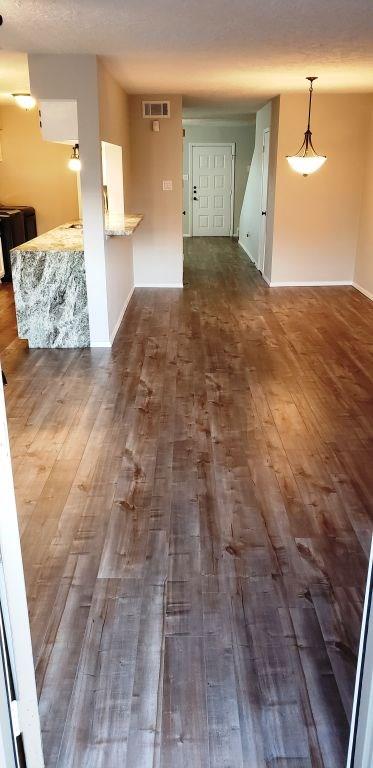
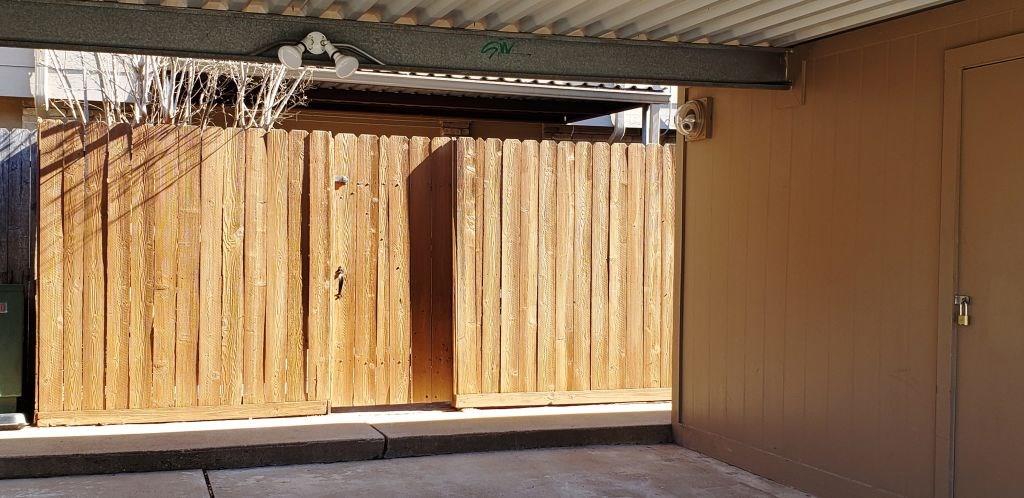
Completely remodeled Dec. 2019 with paint, floors, fixtures, lighting, blinds, fans, master walk-in closet, carpet, patio & bathroom tile, granite countertops, sinks, and all new matching appliances. Beautiful streets with mature oak trees, terrific area of town with amazing shopping and restaurants and only 7 minutes to 290 or 10 minutes to I-10. HOA manages all exterior maintenance and security cameras for easy living. Never flooded. Turn-key ready!
Premium Content
Get full access to Premium Content
Sold Price for nearby listings,
Property History Reports and more.
Sign Up or
Log In Now
General Description
Sold Price Range:
$140,001 - $160,000
Address:
6673 Kentwick Drive 2/16
Legal Description:
TR 10B & 11 BLK 5 LANGHAM CREEK COLONY T/H SEC 1
Property Type:
Townhouse/Condo - Townhouse
Baths:
2 Full & 1 Half Bath(s)
Year Built:
1981 / Appraisal District
Building Sqft.:
1,840 171(m²) /Appraisal District
Lot Size:
1,760 Sqft. 164(m²) /Appraisal District
Maintenance Fee:
$ 200 / Monthly
Ready to sell your home?
If you are considering selling your home, you may find out how now. Request your home selling analysis featuring Recently Sold, Market Analysis, Home Valuations and Market Update.
GET STARTED
Room Dimension
Primary Bedroom:
15X18, 1st
Utility Room Desc:
4X8, 1st
Interior Features
Floors:
Carpet, Laminate, Stone, Tile
Cooling:
Central Electric
Range:
Gas Cooktop, Gas Range
Energy Feature:
Ceiling Fans, Energy Star Appliances
Exterior Features
Water Sewer:
Other Water/Sewer, Public Sewer, Public Water
Assigned School Information
School information is computer generated and may not be accurate or current. Buyer must independently verify and confirm enrollment. Please contact the school district to determine the schools to which this property is zoned.
Listing Broker: Listing Results, LLC
Email Listing Broker
Selling Broker: Non MLS
Last updated as of: 07/18/2024
Property Tax
Market Value Per Appraisal District
Cost/Sqft based on Market Value
Tax Year
Cost/sqft
Market Value
Change
Tax Assessment
Change
2023
$111.11
$204,447
13.09% $204,447
13.09%
2022
$98.26
$180,790
21.57% $180,790
21.57%
2021
$80.82
$148,712
14.70% $148,712
14.70%
2020
$70.46
$129,652
6.01% $129,652
6.01%
2019
$66.47
$122,302
21.73% $122,302
21.73%
2018
$54.60
$100,466
11.88% $100,466
11.88%
2017
$48.80
$89,796
15.12% $89,796
15.12%
2016
$42.39
$78,001
-1.38% $78,001
-1.38%
2015
$42.98
$79,092
20.81% $79,092
20.81%
2014
$35.58
$65,468
10.34% $65,468
10.34%
2013
$32.25
$59,331
0.00% $59,331
0.00%
2012
$32.25
$59,331
$59,331
2023 Harris County Appraisal District Tax Value
Market Land Value:
$32,385
Market Improvement Value:
$172,062
Total Market Value : $204,447
2023 Tax Rates
CYPRESS-FAIRBANKS ISD:
1.0811 %
HARRIS COUNTY:
0.3501 %
HC FLOOD CONTROL DIST:
0.0311 %
PORT OF HOUSTON AUTHORITY:
0.0057 %
HC HOSPITAL DIST:
0.1434 %
HC DEPARTMENT OF EDUCATION:
0.0048 %
LONE STAR COLLEGE SYS:
0.1076 %
HC MUD 102:
0.4350 %
HC EMERG SRV DIST 9:
0.0444 %
Total Tax Rate : 2.2032 %