Sold Price Range: $120,001 - $140,000
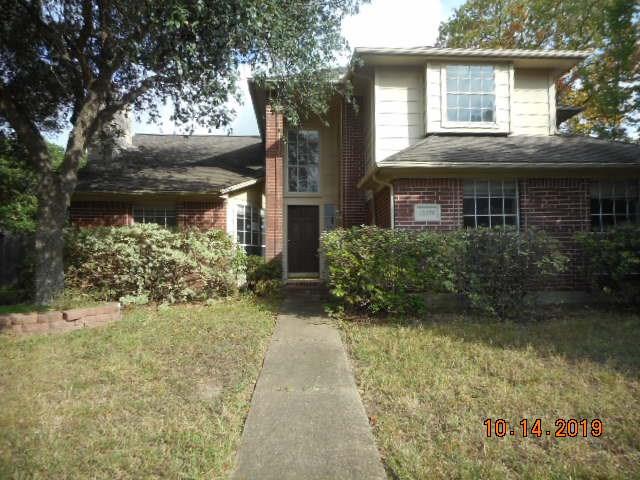
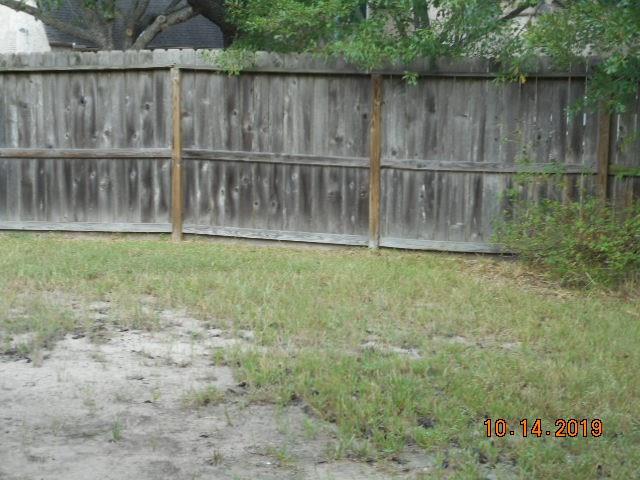
TLC Needed. Large, corner lot. Garage is behind the house, access via Alley. Master Bedroom, Master Bath, kitchen, breakfast room, dining room, den and 1/2 bath downstairs. 2 bedrooms and full bath up. Investors Look at this one!!
Premium Content
Get full access to Premium Content
Sold Price for nearby listings,
Property History Reports and more.
Sign Up or
Log In Now
General Description
Sold Price Range:
$120,001 - $140,000
Address:
15326 Bellport Drive
Legal Description:
LT 14 BLK 1 LANGHAM CREEK COLONY 1 PAR R/P
Property Type:
Single-Family
Baths:
2 Full & 1 Half Bath(s)
Year Built:
1992 / Appraisal District
Building Sqft.:
1,815 169(m²) /Appraisal District
Lot Size:
7,207 Sqft. 670(m²) /Appraisal District
Maintenance Fee:
$ 450 / Annually
Ready to sell your home?
If you are considering selling your home, you may find out how now. Request your home selling analysis featuring Recently Sold, Market Analysis, Home Valuations and Market Update.
GET STARTED
Room Dimension
Primary Bedroom:
14x16, 1st
Interior Features
Number Of Dinning Area:
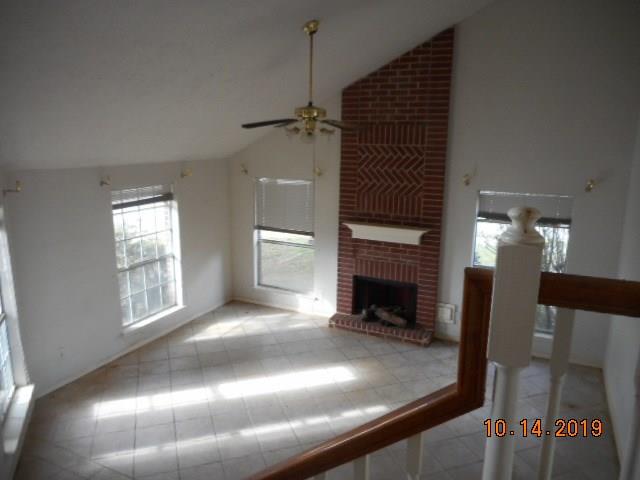
Family Room
Room Description:
Family Room
Bedroom Description:
Primary Bed - 1st Floor
Cooling:
Central Electric
Exterior Features
Exterior Type:
Brick & Wood
Water Sewer:
Water District
Assigned School Information
School information is computer generated and may not be accurate or current. Buyer must independently verify and confirm enrollment. Please contact the school district to determine the schools to which this property is zoned.
Listing Broker: The Mercury Alliance, LLC
Email Listing Broker
Selling Broker: 5th Stream Realty
Last updated as of: 07/18/2024
Property Tax
Market Value Per Appraisal District
Cost/Sqft based on Market Value
Tax Year
Cost/sqft
Market Value
Change
Tax Assessment
Change
2023
$132.66
$240,786
10.92% $240,786
10.92%
2022
$119.61
$217,087
23.39% $217,087
23.39%
2021
$96.93
$175,937
6.72% $175,937
6.72%
2020
$90.83
$164,862
16.14% $164,862
16.14%
2019
$78.21
$141,946
-13.03% $141,946
-13.03%
2018
$89.92
$163,212
0.00% $163,212
20.20%
2017
$89.92
$163,212
29.29% $135,780
10.00%
2016
$69.55
$126,242
12.50% $123,437
10.00%
2015
$61.83
$112,216
6.46% $112,216
6.46%
2014
$58.07
$105,405
6.31% $105,405
6.31%
2013
$54.63
$99,147
0.00% $99,147
0.00%
2012
$54.63
$99,147
$99,147
2023 Harris County Appraisal District Tax Value
Market Land Value:
$50,902
Market Improvement Value:
$189,884
Total Market Value : $240,786
2023 Tax Rates
CYPRESS-FAIRBANKS ISD:
1.0811 %
HARRIS COUNTY:
0.3501 %
HC FLOOD CONTROL DIST:
0.0311 %
PORT OF HOUSTON AUTHORITY:
0.0057 %
HC HOSPITAL DIST:
0.1434 %
HC DEPARTMENT OF EDUCATION:
0.0048 %
LONE STAR COLLEGE SYS:
0.1076 %
HC MUD 102:
0.4350 %
HC EMERG SRV DIST 9:
0.0444 %
Total Tax Rate : 2.2032 %