Sold Price Range: $215,001 - $250,000
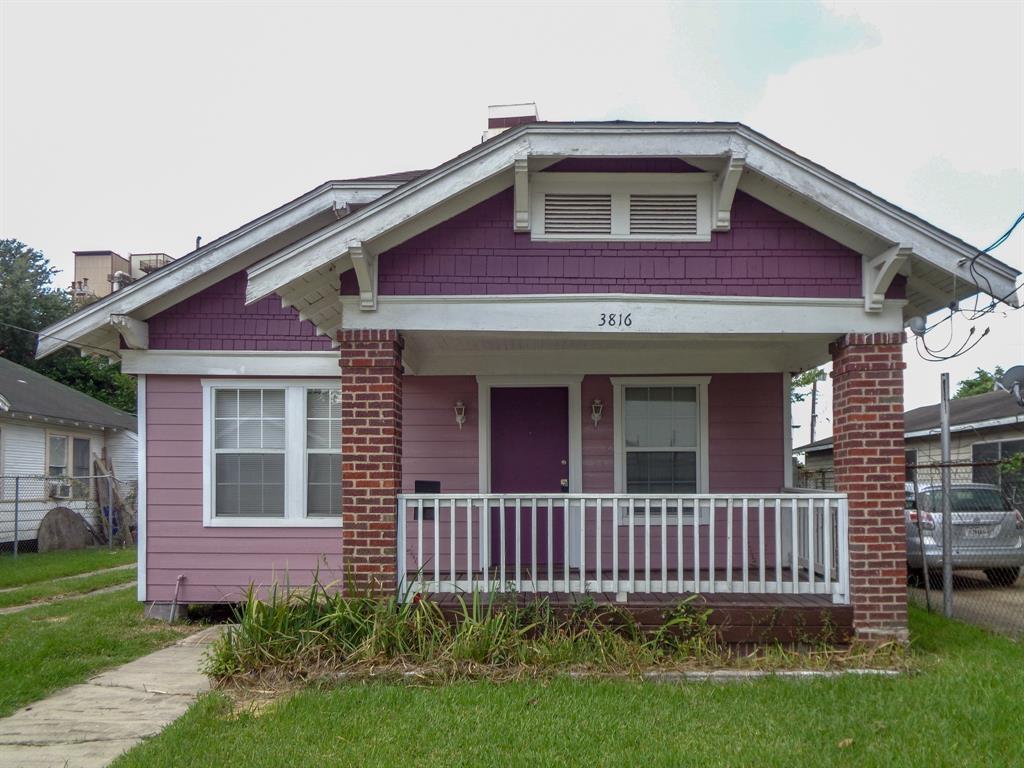
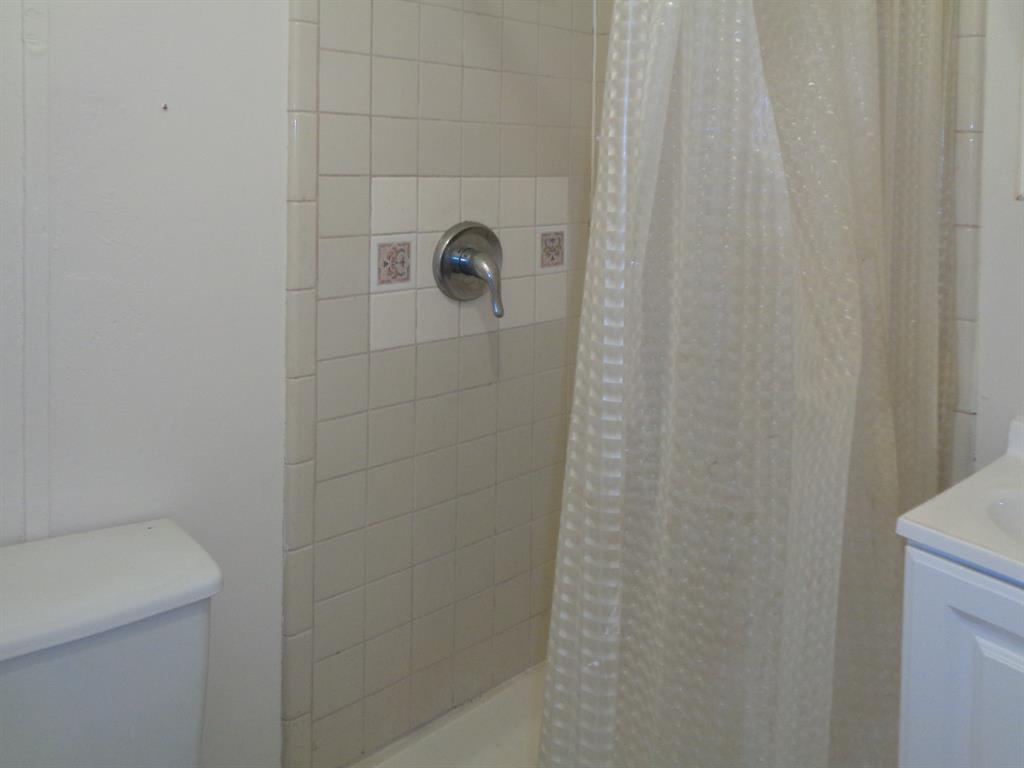
VERY CLOSE TO LIGHT RAIL. 1 STORY, NICE KITCHEN, 2 BEDROOMS, 1 BATH, MINI-BLINDS, STOVE INCLUDED. HAS AN ADDITIONAL EFFICIENTLY FOR LIVING OR OFFICE SPACE BEHIND THE HOUSE. BOTH UNITS HAVE SEPARATE POWER METERS BUT SHARE WATER.
Premium Content
Get full access to Premium Content
Sold Price for nearby listings,
Property History Reports and more.
Sign Up or
Log In Now
General Description
Sold Price Range:
$215,001 - $250,000
Address:
3816 Wilmer Street
Legal Description:
LT 18 BLK 1 BRADY HOME
Property Type:
Single-Family
Year Built:
1929 / Appraisal District
Building Sqft.:
880 82(m²) /Appraisal District
Lot Size:
4,700 Sqft. 437(m²) /Appraisal District
Ready to sell your home?
If you are considering selling your home, you may find out how now. Request your home selling analysis featuring Recently Sold, Market Analysis, Home Valuations and Market Update.
GET STARTED
Room Dimension
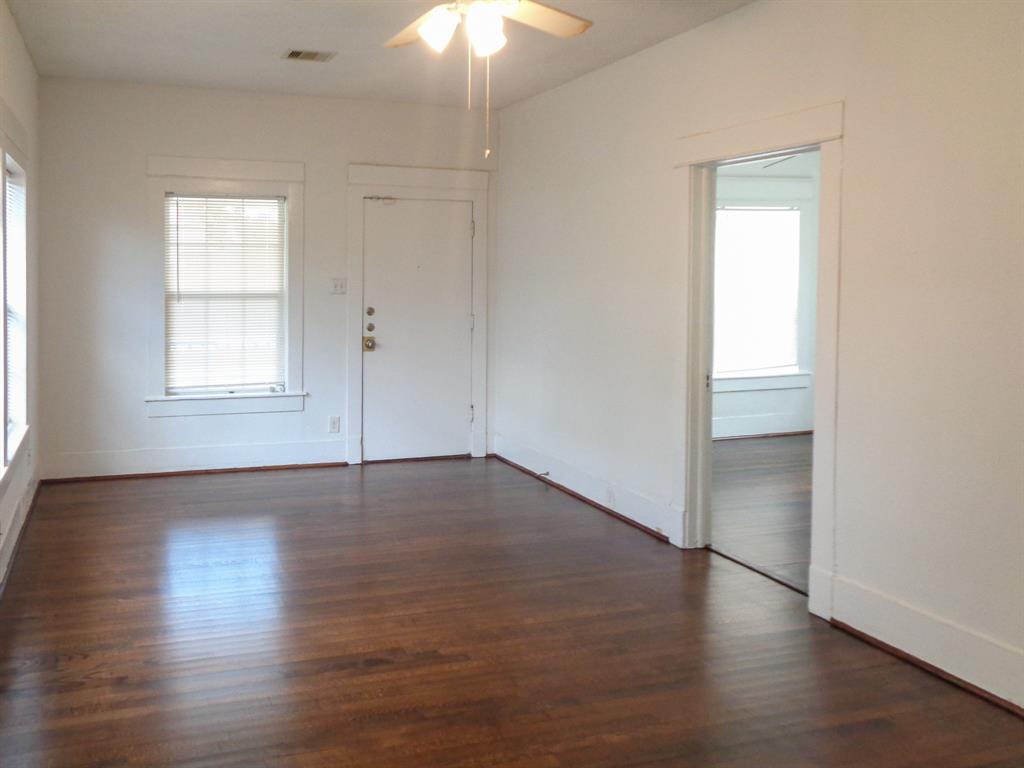
Living:
21X14, Living/Dining combo, 1st,
Utility Room Desc:
In House
Interior Features
Number Of Dinning Area:
Living/Dining Combo, Utility Room in House
Room Description:
Living/Dining Combo, Utility Room in House
Bedroom Description:
2 Bedrooms Down, All Bedrooms Down
Cooling:
Central Electric
Connections:
Gas Dryer Connections, Washer Connections
Energy Feature:
Ceiling Fans
Exterior Features
Exterior Type:
Brick & Wood
Lot Description:
Subdivision Lot
Water Sewer:
Public Sewer, Public Water
Unit Location:
Subdivision Lot
Assigned School Information
School information is computer generated and may not be accurate or current. Buyer must independently verify and confirm enrollment. Please contact the school district to determine the schools to which this property is zoned.
Listing Broker: Aim Realty
Email Listing Broker
Selling Broker: Main Realty
Last updated as of: 07/21/2024
Property Tax
Market Value Per Appraisal District
Cost/Sqft based on Market Value
Tax Year
Cost/sqft
Market Value
Change
Tax Assessment
Change
2023
$331.48
$291,698
12.38% $277,108
10.00%
2022
$294.96
$259,565
13.34% $251,917
10.00%
2021
$260.25
$229,016
1.66% $229,016
1.66%
2020
$256.00
$225,283
25.16% $225,283
25.16%
2019
$204.55
$180,000
-0.78% $180,000
-0.78%
2018
$206.15
$181,409
51.17% $181,409
51.17%
2017
$136.36
$120,000
0.00% $120,000
0.00%
2016
$136.36
$120,000
-12.83% $120,000
-12.83%
2015
$156.43
$137,655
35.24% $137,655
35.24%
2014
$115.67
$101,786
97.05% $101,786
97.05%
2013
$58.70
$51,656
0.00% $51,656
0.00%
2012
$58.70
$51,656
$51,656
2023 Harris County Appraisal District Tax Value
Market Land Value:
$172,725
Market Improvement Value:
$118,973
Total Market Value : $291,698
2023 Tax Rates
HOUSTON ISD:
0.8683 %
HARRIS COUNTY:
0.3501 %
HC FLOOD CONTROL DIST:
0.0311 %
PORT OF HOUSTON AUTHORITY:
0.0057 %
HC HOSPITAL DIST:
0.1434 %
HC DEPARTMENT OF EDUCATION:
0.0048 %
HOUSTON COMMUNITY COLLEGE:
0.0922 %
HOUSTON CITY OF:
0.5192 %
GREATER EAST END MGMT:
0.1500 %
Total Tax Rate : 2.1648 %