Sold Price Range: $185,001 - $215,000
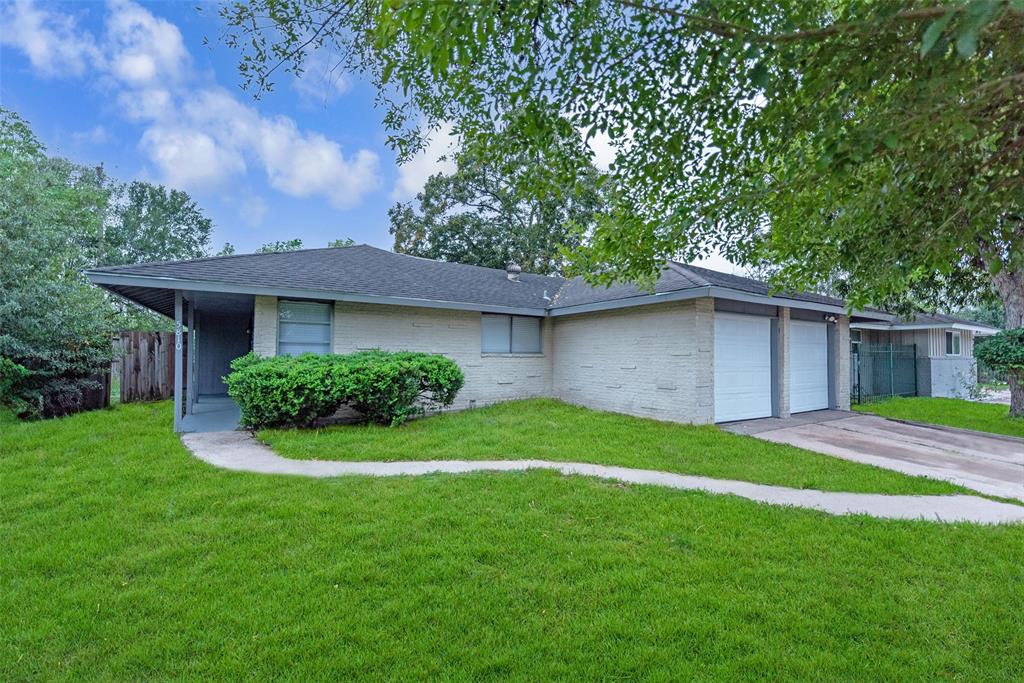
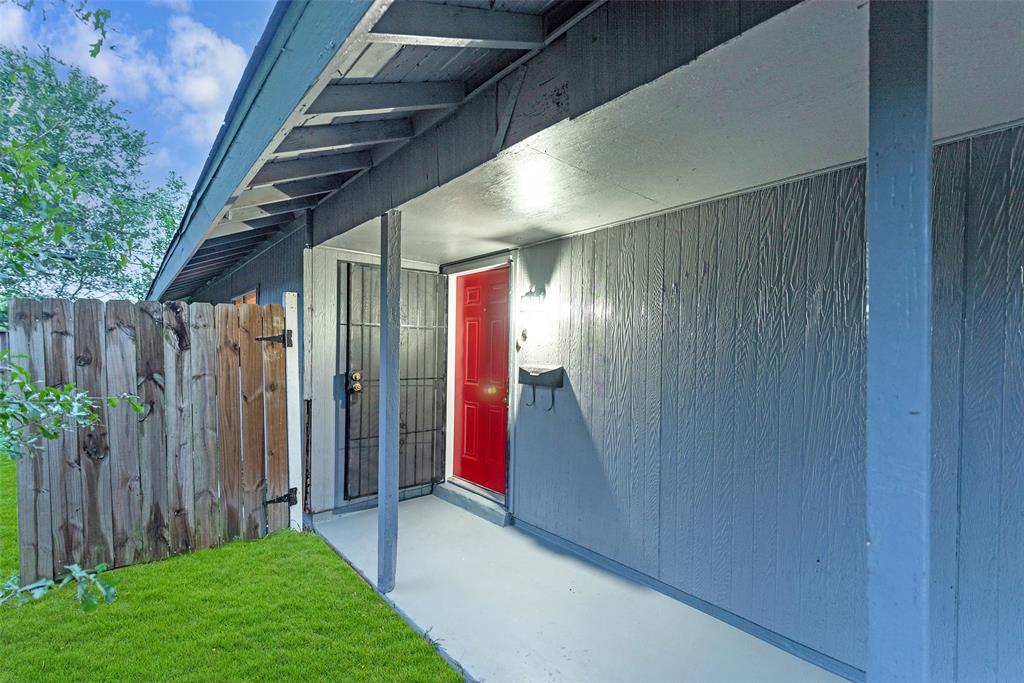
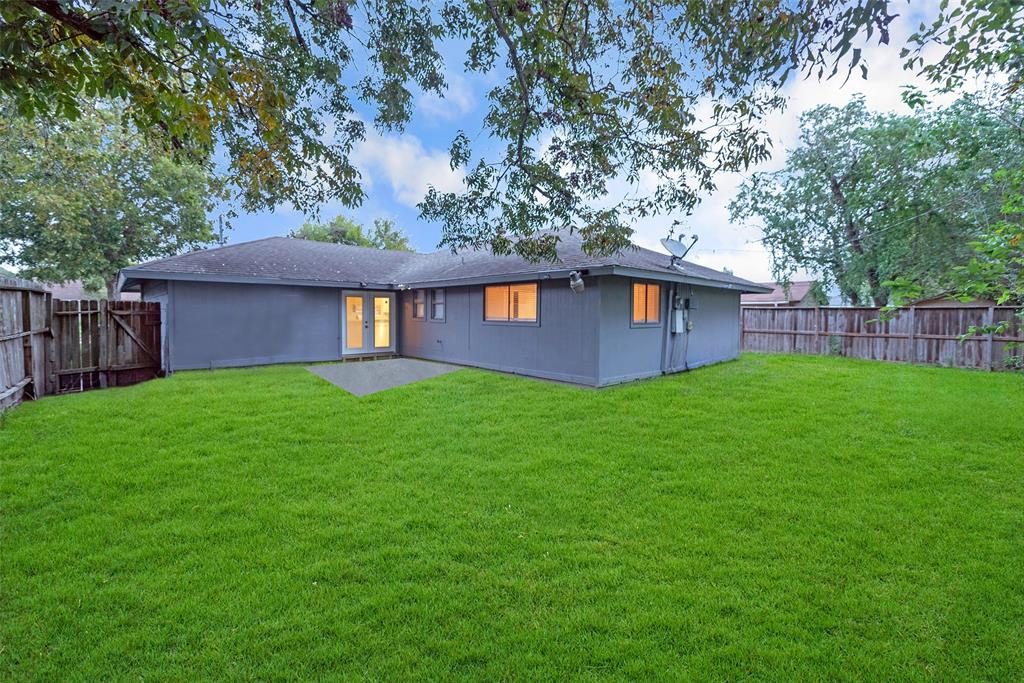
Beautiful home in a well maintained and established neighborhood near Beltway 8 and 288 South. Just painted inside and out. This home has a great Open floor plan. Formal Living room, beautiful hardwood floors throughout, no carpet. Kitchen is open to the family room and eat-in bar. Spacious primary bedroom overlooking the back yard with access to bath. Huge Backyard is perfect for bbq's and family gatherings! The pictures speak for themselves.
Premium Content
Get full access to Premium Content
Sold Price for nearby listings,
Property History Reports and more.
Sign Up or
Log In Now
General Description
Sold Price Range:
$185,001 - $215,000
Address:
5810 Schevers St
Legal Description:
LT 3 BLK 20 EDGEWOOD TERRACE SEC 4
Property Type:
Single-Family
Baths:
1 Full & 1 Half Bath(s)
Year Built:
1956 / Appraisal District
Building Sqft.:
1,369 127(m²) /Appraisal District
Lot Size:
6,867 Sqft. 638(m²) /Appraisal District
Ready to sell your home?
If you are considering selling your home, you may find out how now. Request your home selling analysis featuring Recently Sold, Market Analysis, Home Valuations and Market Update.
GET STARTED
Room Dimension
Utility Room Desc:
In House
Interior Features
Bedroom Description:
All Bedrooms Down
Room Description:
Den, Formal Living, Utility Room in House
Bathroom Description:
Half Bath
Cooling:
Central Electric
Connections:
Electric Dryer Connections, Washer Connections
Range:
Freestanding Range
Energy Feature:
Ceiling Fans
Exterior Features
Exterior Type:
Brick, Wood
Lot Description:
Subdivision Lot
Water Sewer:
Public Sewer, Public Water
Assigned School Information
School information is computer generated and may not be accurate or current. Buyer must independently verify and confirm enrollment. Please contact the school district to determine the schools to which this property is zoned.
Listing Broker: A'Lon Realty Co.
Email Listing Broker
Selling Broker: Prime Realty Group
Last updated as of: 07/21/2024
Property Tax
Market Value Per Appraisal District
Cost/Sqft based on Market Value
Tax Year
Cost/sqft
Market Value
Change
Tax Assessment
Change
2023
$93.60
$128,145
-1.40% $128,145
-1.40%
2022
$94.93
$129,962
31.69% $129,962
31.69%
2021
$72.09
$98,688
13.78% $98,688
13.78%
2020
$63.36
$86,733
9.94% $86,733
9.94%
2019
$57.63
$78,894
6.62% $78,894
6.62%
2018
$54.05
$73,993
23.32% $73,993
23.32%
2017
$43.83
$60,000
-1.47% $60,000
-1.47%
2016
$44.48
$60,894
6.56% $60,894
6.56%
2015
$41.74
$57,143
111.64% $57,143
111.64%
2014
$19.72
$27,000
-27.59% $27,000
-27.59%
2013
$27.24
$37,286
0.00% $37,286
0.00%
2012
$27.24
$37,286
$37,286
2023 Harris County Appraisal District Tax Value
Market Land Value:
$66,835
Market Improvement Value:
$61,310
Total Market Value : $128,145
2023 Tax Rates
HOUSTON ISD:
0.8683 %
HARRIS COUNTY:
0.3501 %
HC FLOOD CONTROL DIST:
0.0311 %
PORT OF HOUSTON AUTHORITY:
0.0057 %
HC HOSPITAL DIST:
0.1434 %
HC DEPARTMENT OF EDUCATION:
0.0048 %
HOUSTON COMMUNITY COLLEGE:
0.0922 %
HOUSTON CITY OF:
0.5192 %
Total Tax Rate : 2.0148 %