Housing & Rental Affordability
Archive Reports
Media Contacts
Brittany Aucion
Matthew Burrus
Housing & Rental Affordability
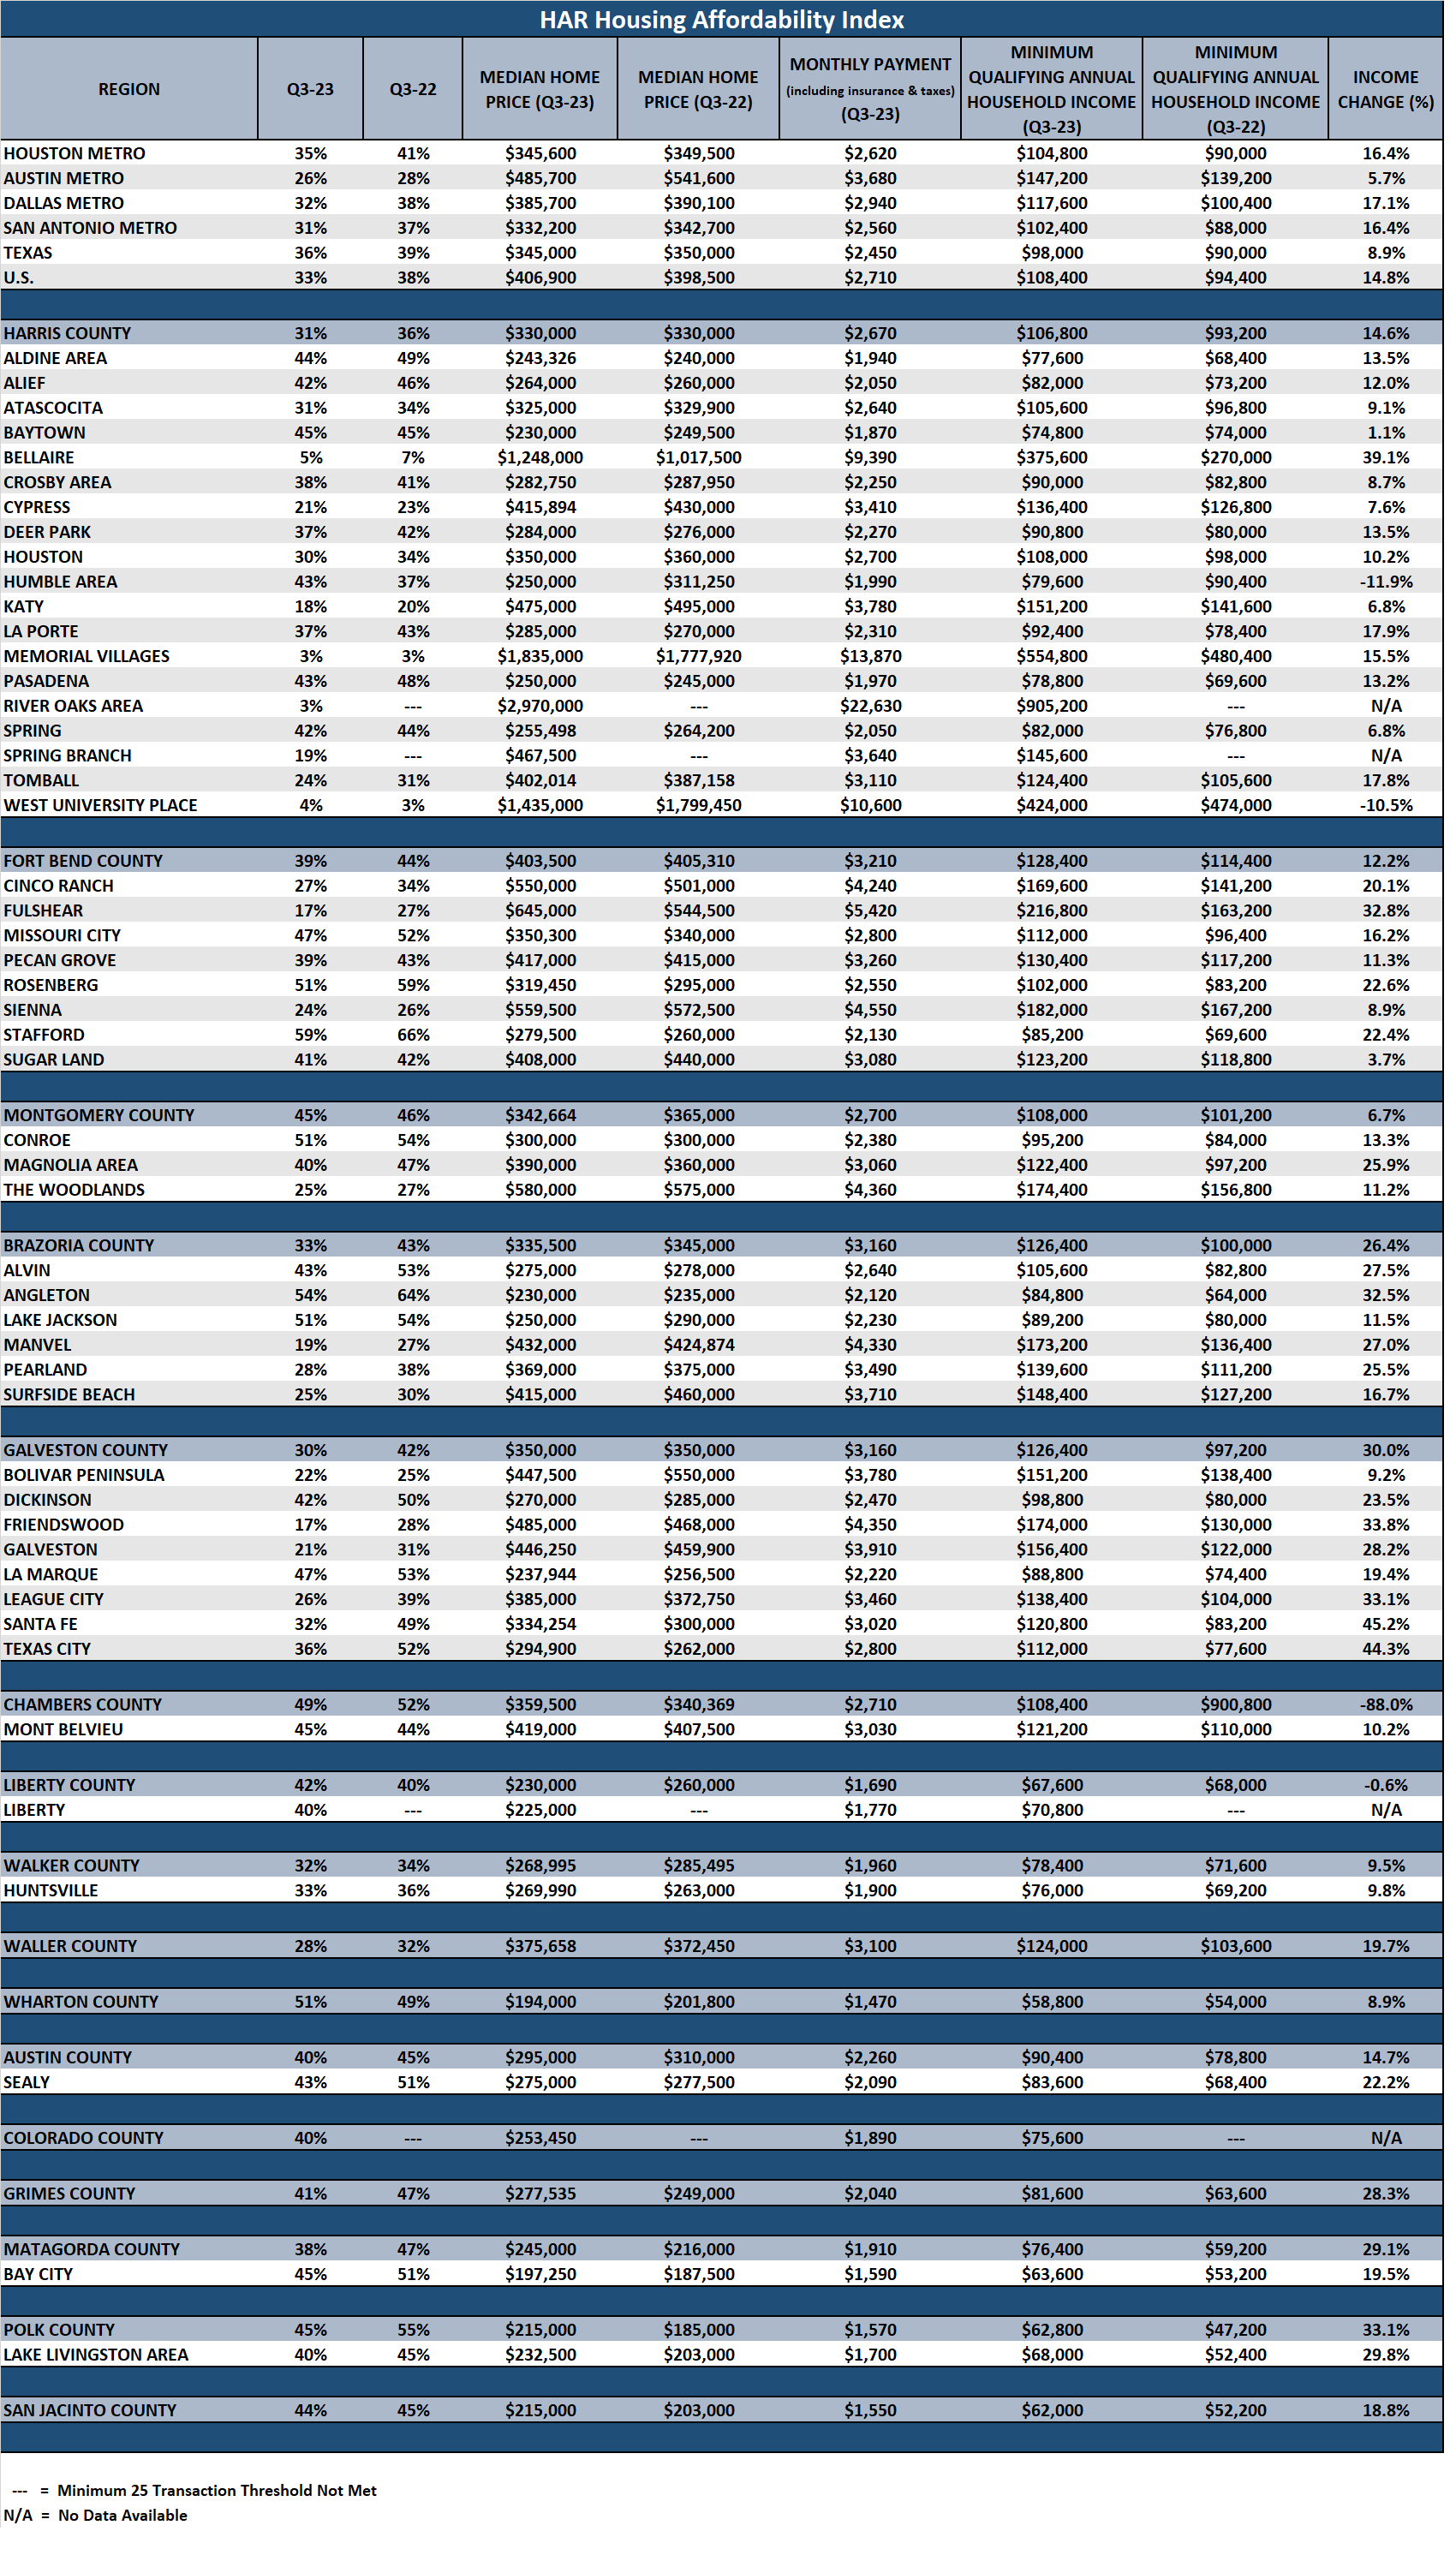
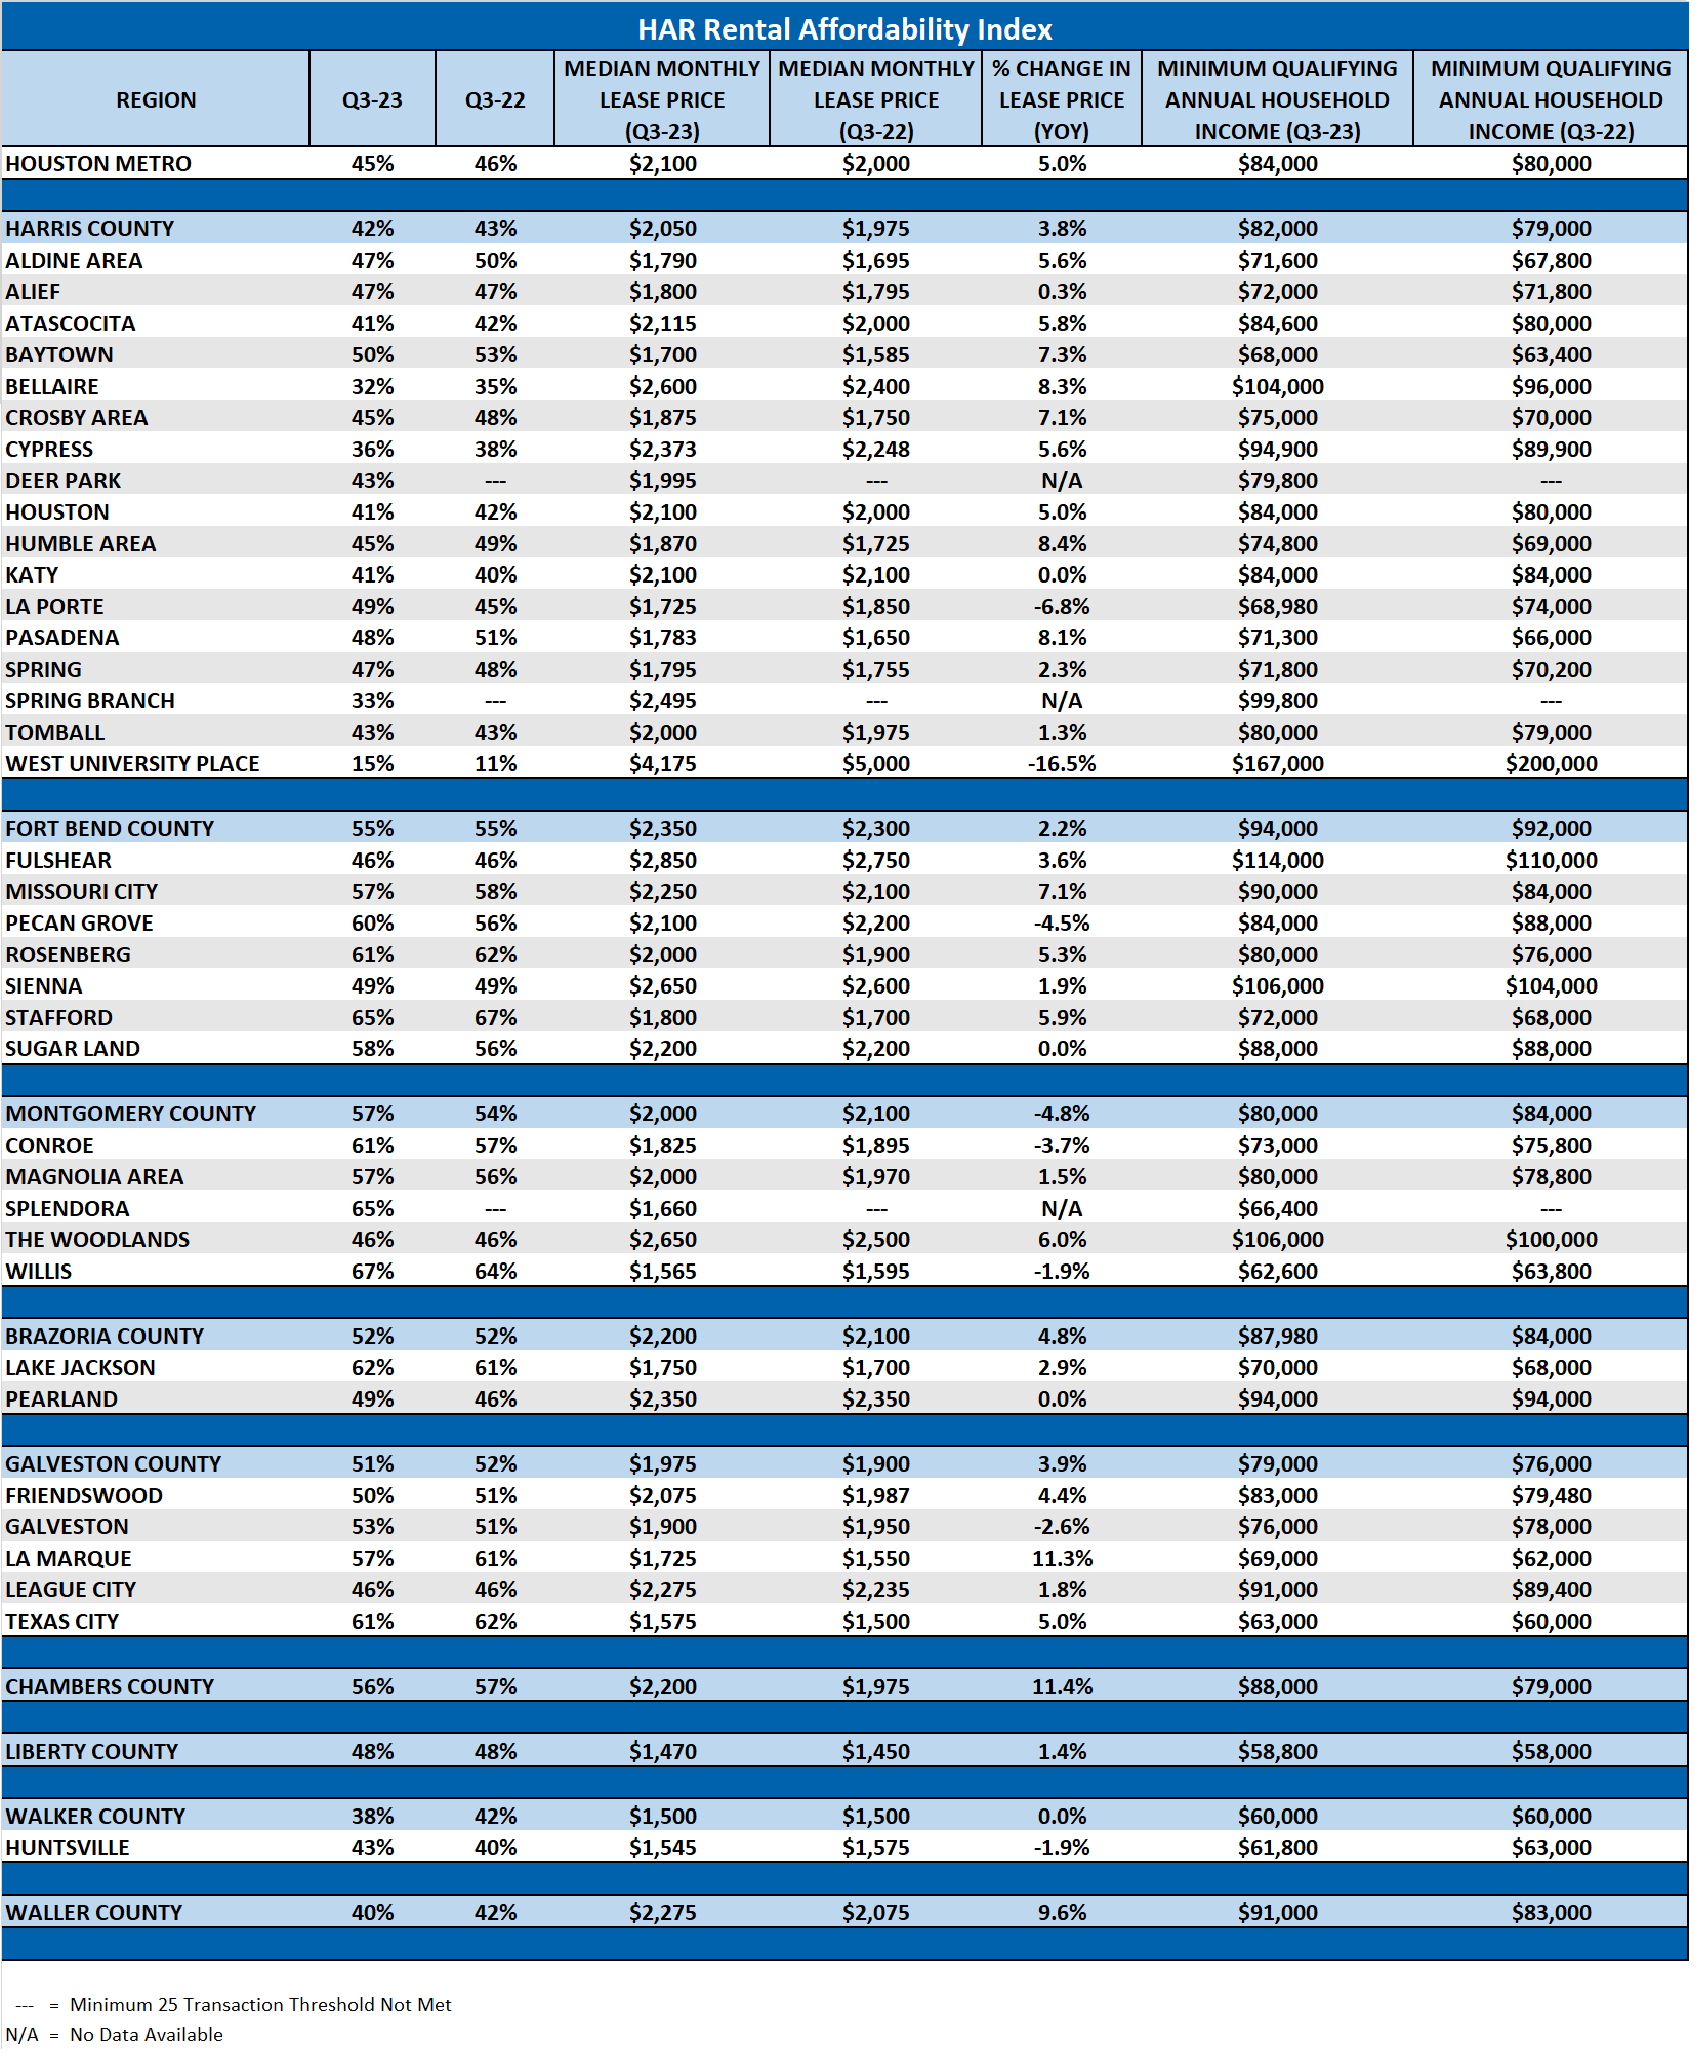
HAR's Housing Affordability Index measures the percentage of households that can afford to purchase a median-priced, single-family home for regions and select counties in Texas. It also identifies the minimum income required to purchase the median-priced home in a variety of neighborhoods. HAR's Rental Affordability Index measures the percentage of households that can afford to pay the median monthly lease price for a single-family home in the Houston area. Reports are issued in February, May, August and November.
Read the Q3 2023 Release HERE | Housing & Rental Affordability Methodology
Understanding the Chart | Example: 44 percent of households in Harris County made the minimum annual income of $77,600 to afford a $243,326 median-priced home in the Aldine Area in Q3 2023. Homebuyers need to earn 13.5% more income than they did a year ago to afford a median-priced home in the Aldine Area.
Q3 2023
Download the Full Report | XLS
Download the Presentation | PDF
View the Q3-23 Slideshow | YouTube
Download the Historical Data | XLS
Download the Full Report | XLS
Download the Presentation | PDF
View the Q2-23 Slideshow | YouTube
Download the Historical Data | XLS
Q1 2023
Download the Full Report | XLS
Download the Presentation | PDF
View the Q1-23 Slideshow | YouTube
Q4 2022
Download the Full Report | XLS
Download the Presentation | PDF
View the Q4-22 Slideshow | YouTube
Q3 2022
Download the Full Report | XLS
Download the Presentation | PDF
View the Q3-22 Slideshow | YouTube
Q2 2022
Download the Full Report | XLS
Download the Presentation | PDF
View the Q2-22 Slideshow | YouTube
Q1 2022
Download the Full Report | XLS
Download the Presentation | PDF
View the Q1-22 Slideshow | YouTube

