What is the real estate market like in Richmond, Texas?
What is the real estate market like in Richmond, Texas?
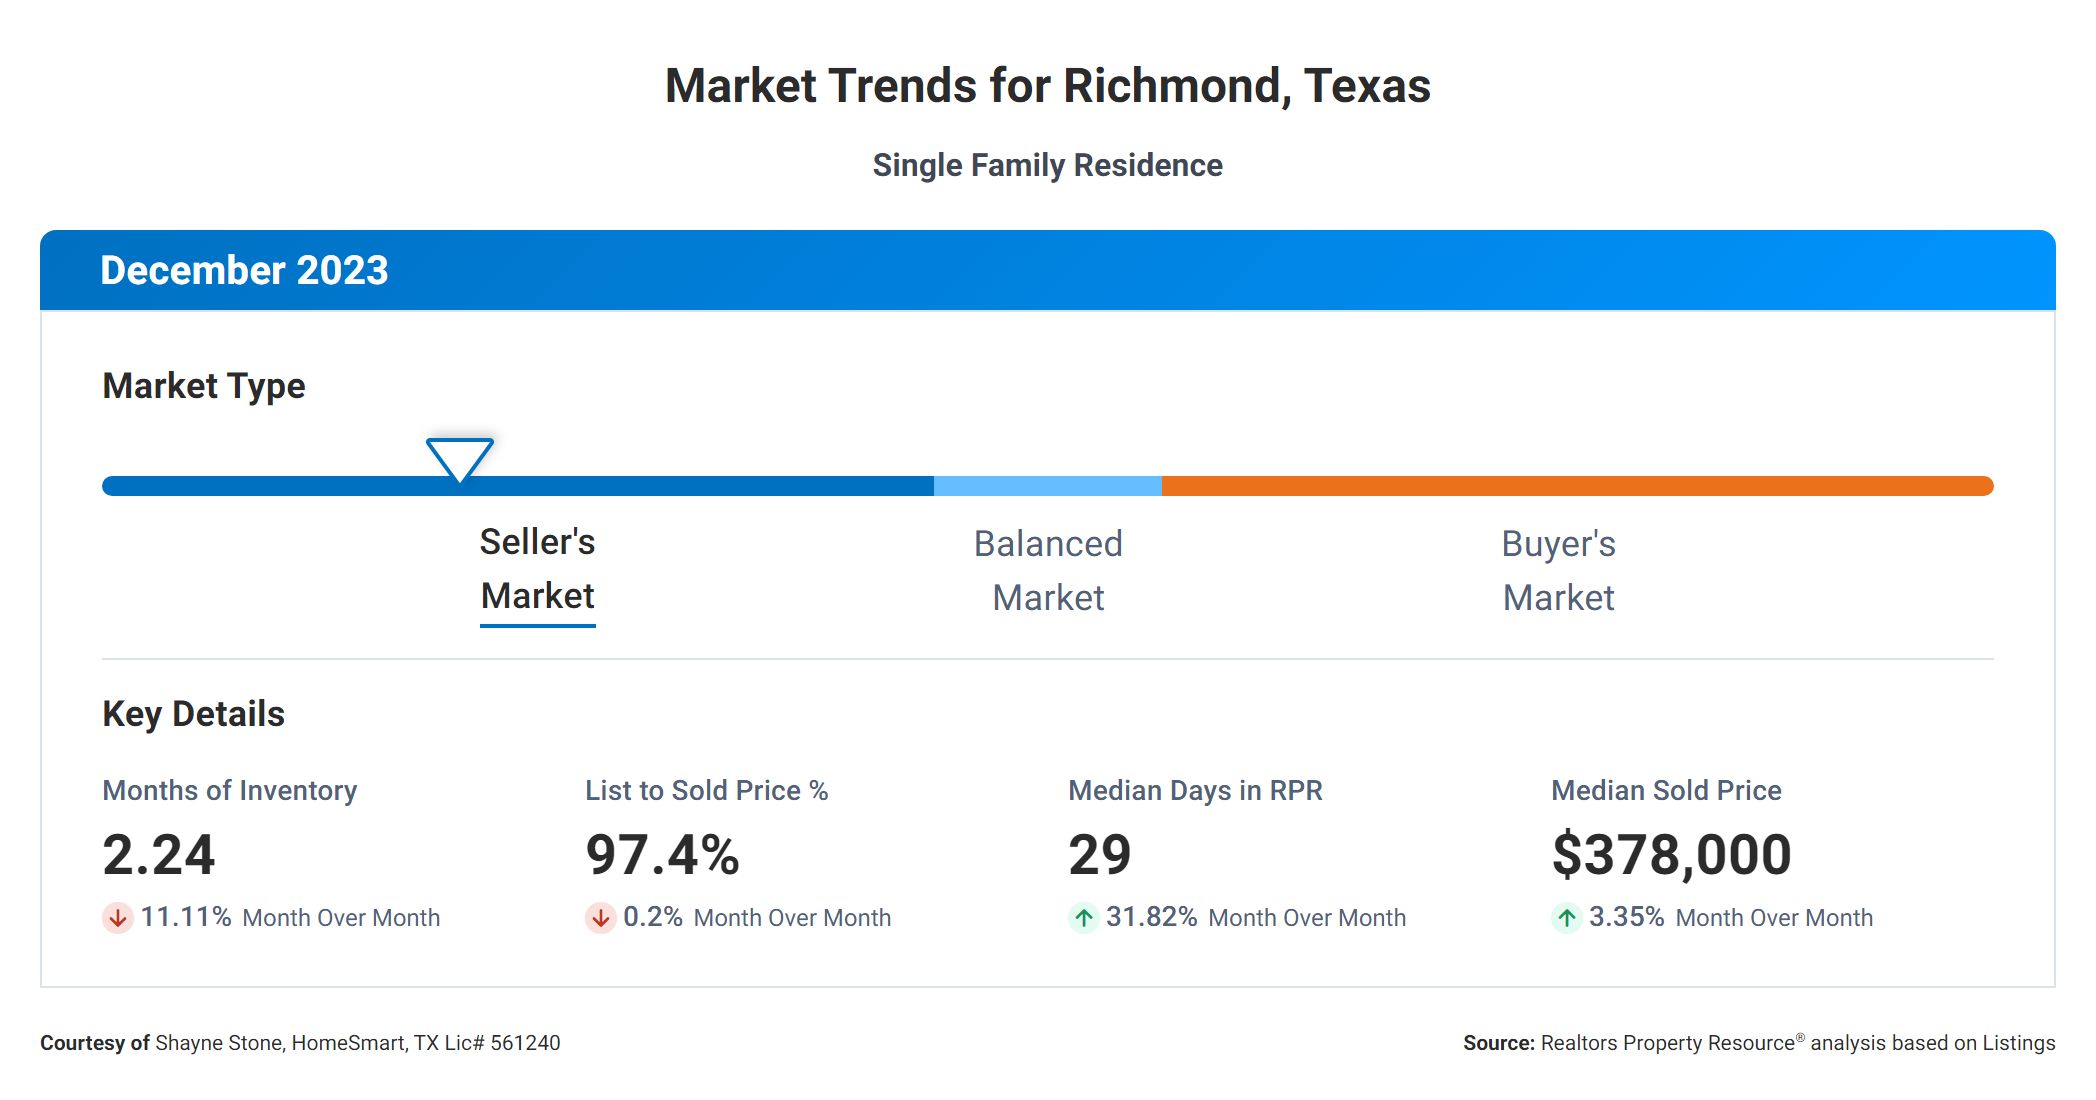
December 2023
When it comes to evaluating the real estate market, several metrics play a crucial role in understanding its dynamics. For buyers and sellers, understanding these metrics can help them make informed decisions. Let's dive into the correlation between the following real estate metrics: Months Supply of Inventory, 12-Month Change in Months of Inventory, Median Days Homes are On the Market, List to Sold Price Percentage, and Median Sold Price.
First, let's examine the Months Supply of Inventory, which currently stands at 2.24. This metric represents the number of months it would take to sell all the homes on the market if no new listings were added. A lower supply indicates a seller's market, where demand exceeds supply, potentially leading to higher prices and quicker sales.

Now, let's explore the 12-Month Change in Months of Inventory, which shows a positive growth of 10.89%. This figure indicates the percentage change in the Months Supply of Inventory compared to the previous year. A positive change suggests that inventory levels are increasing, potentially favoring buyers as they have more options to choose from. However, sellers may need to adjust their pricing and marketing strategies to remain competitive in such a market.
Moving on to Median Days Homes are On the Market, we find that it currently stands at 29 days. This metric represents the average number of days it takes for a home to go from listing to sale. A lower number of days indicates a faster-paced market, where homes are in high demand and tend to sell quickly. Conversely, a higher number of days may suggest a slower market, where buyers have more time to consider their options.
Next, let's examine the List to Sold Price Percentage, which currently sits at 97.4%. This metric shows the percentage of the listing price that a home ultimately sells for. A higher percentage indicates that homes tend to sell closer to their listing price, potentially indicating a competitive market where sellers have the upper hand. Conversely, a lower percentage may suggest more negotiation power for buyers.
Finally, we have the Median Sold Price, which currently stands at $378,000. This metric represents the middle point of all the sold prices in a given area. It provides a general idea of the market's price range. Buyers and sellers can use this metric to gauge the overall affordability and value of properties within a specific market.
Understanding the correlation between these real estate metrics allows buyers and sellers to assess the current market conditions. For instance, a low Months Supply of Inventory, coupled with a shorter Median Days Homes are On the Market, may indicate a competitive seller's market, potentially leading to higher prices. On the other hand, a higher 12-Month Change in Months of Inventory could suggest a shift towards a buyer's market with increased inventory and potentially more favorable pricing.
Moreover, the List to Sold Price Percentage can help both buyers and sellers understand how negotiations may unfold, with higher percentages indicating less room for price reductions. Lastly, the Median Sold Price offers insights into the overall price range of homes being sold, allowing buyers and sellers to gauge the market's affordability.
By considering these real estate metrics, buyers and sellers can make more informed decisions, adapt their strategies, and navigate the market with confidence. Remember, every market is unique, and consulting with a real estate professional is always recommended to obtain tailored advice based on specific circumstances.
For a more detail Real Estate Market Report for Richmond and/or other reports for Ft Bend County or YOU want to learn theMarket Valueof YOUR HOME -CLICK HERE!!!