Sold Price Range: $215,001 - $250,000
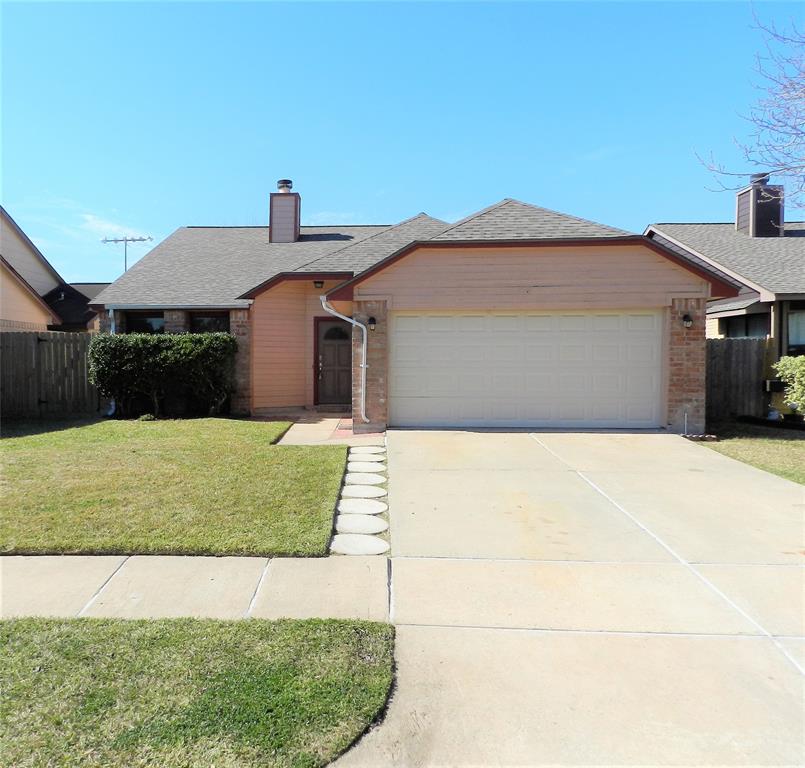
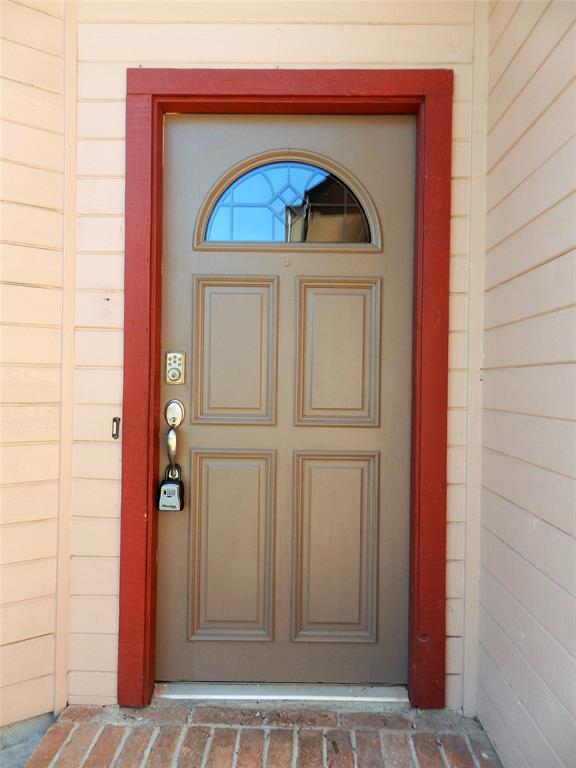
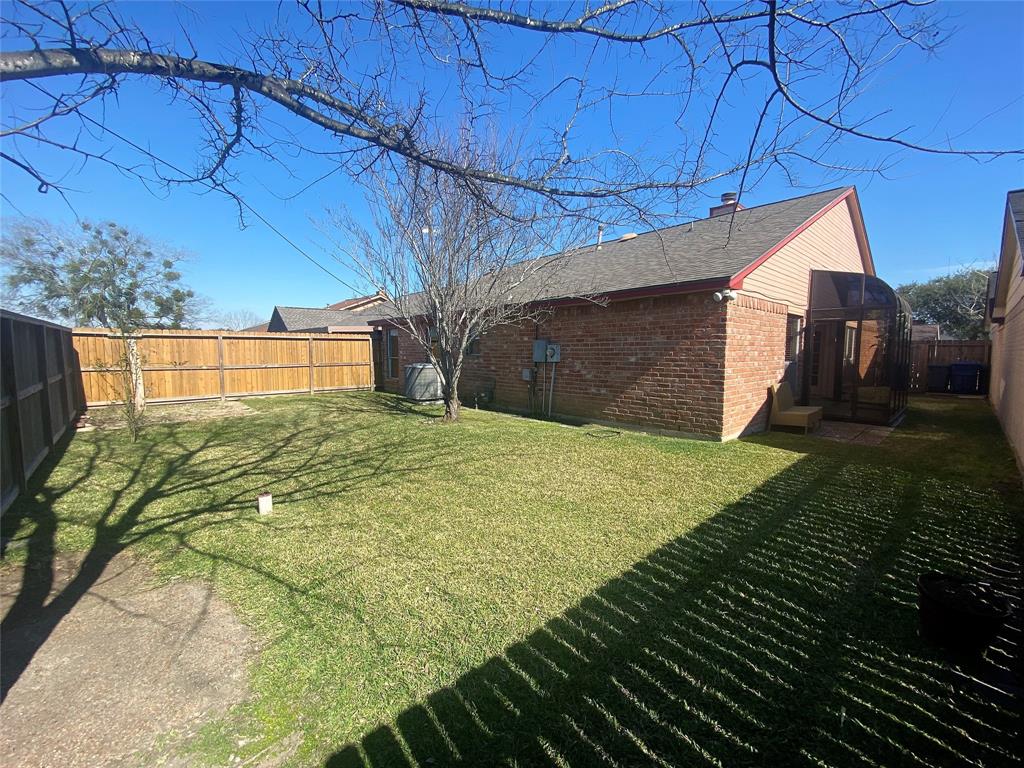
Perfect starter home. New AC unit installed in 2019, Roof replaced in 2018, Water softener installed to purify water throughout entire home. Laminate Floors, granite kitchen countertops, large backyard to enjoy a family gathering, sunroof for personal use.
Premium Content
Get full access to Premium Content
Sold Price for nearby listings,
Property History Reports and more.
Sign Up or
Log In Now
General Description
Sold Price Range:
$215,001 - $250,000
Address:
2026 Woodland Hills Drive
Legal Description:
HUNTERS GREEN, BLOCK 1, LOT 55
Property Type:
Single-Family
Year Built:
1984 / Appraisal
Building Sqft.:
1,590 148(m²) /Seller
Lot Size:
5,356 Sqft. 498(m²) /Appraisal District
Maintenance Fee:
$ 354 / Annually
Ready to sell your home?
If you are considering selling your home, you may find out how now. Request your home selling analysis featuring Recently Sold, Market Analysis, Home Valuations and Market Update.
GET STARTED
Room Dimension
Primary Bedroom:
15x17, 1st
Interior Features
Fireplace:
1/Gas Connections
Bedroom Description:
All Bedrooms Down
Cooling:
Central Electric
Connections:
Electric Dryer Connections, Gas Dryer Connections
Energy Feature:
High-Efficiency HVAC
Exterior Features
Exterior Type:
Brick, Cement Board
Water Sewer:
Water District
Assigned School Information
School information is computer generated and may not be accurate or current. Buyer must independently verify and confirm enrollment. Please contact the school district to determine the schools to which this property is zoned.
Listing Broker: BlueRoof Real Estate, LLC
Email Listing Broker
Selling Broker: Keller Williams Realty Metropolitan
Last updated as of: 07/24/2024
Property Tax
Market Value Per Appraisal District
Cost/Sqft based on Market Value
Tax Year
Cost/sqft
Market Value
Change
Tax Assessment
Change
2023
$139.11
$221,189
29.48% $221,189
29.48%
2022
$107.44
$170,830
23.54% $170,830
23.54%
2021
$86.97
$138,280
5.44% $138,280
5.44%
2020
$82.48
$131,150
-2.15% $131,150
-2.15%
2019
$84.30
$134,030
14.81% $134,030
14.81%
2018
$73.42
$116,740
5.64% $116,740
5.64%
2017
$69.50
$110,510
5.72% $110,510
5.72%
2016
$65.74
$104,530
5.11% $104,530
5.11%
2015
$62.55
$99,450
17.11% $99,450
17.11%
2014
$53.41
$84,920
11.88% $84,920
11.88%
2013
$47.74
$75,900
$75,900
2023 Fort Bend County Appraisal District Tax Value
Market Land Value:
$21,000
Market Improvement Value:
$200,189
Total Market Value : $221,189
2023 Tax Rates
FORT BEND ISD:
0.9892 %
HCC MISSOURI CITY:
0.0922 %
CITY OF MISSOURI CITY:
0.5708 %
FT BEND CO GEN:
0.4265 %
FORT BEND DRNG:
0.0124 %
FT BEND WCID 2:
0.2125 %
Total Tax Rate : 2.3037 %