Sold Price Range: $250,001 - $285,000
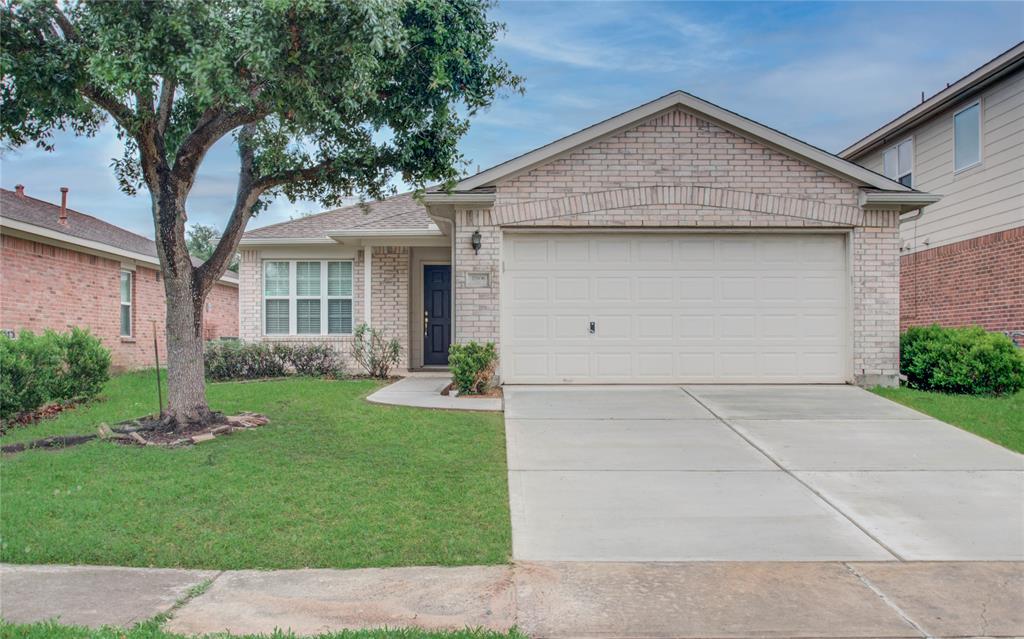
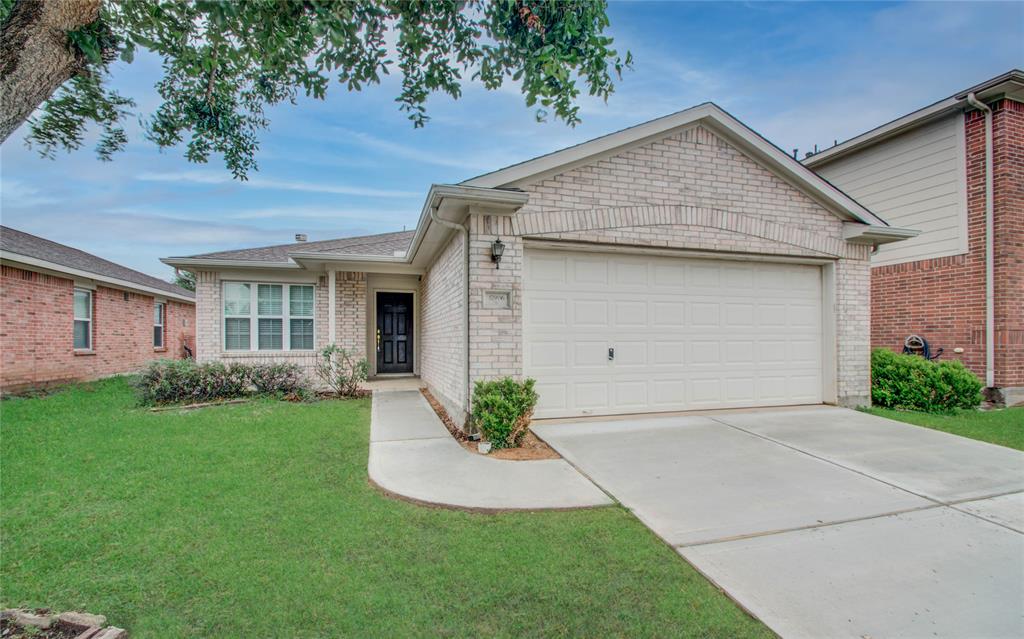
RICHMOND home finders! This stunning one-story home is READY for you to take ownership! The home is in pristine condition and has been well maintained. Open floor plan with NO CARPET; Fresh PAINT, NEW Driveway. 2021 Water Heater; Recent Roof. Close to major freeways, shopping, and restaurants. Call today for your private showings!
Premium Content
Get full access to Premium Content
Sold Price for nearby listings,
Property History Reports and more.
Sign Up or
Log In Now
General Description
Sold Price Range:
$250,001 - $285,000
Address:
17906 Green Trace Lane
Legal Description:
MISSION OAKS SEC 2, BLOCK 1, LOT 2
Property Type:
Single-Family
Year Built:
2005 / Appraisal District
Building Sqft.:
1,492 139(m²) /Appraisal District
Lot Size:
5,002 Sqft. 465(m²) /Appraisal District
Maintenance Fee:
$ 425 / Annually
Ready to sell your home?
If you are considering selling your home, you may find out how now. Request your home selling analysis featuring Recently Sold, Market Analysis, Home Valuations and Market Update.
GET STARTED
Room Dimension
Primary Bedroom:
15x17, 1st
Interior Features
Cooling:
Central Electric
Connections:
Electric Dryer Connections, Gas Dryer Connections, Washer Connections
Energy Feature:
Ceiling Fans
Interior:
Fire/Smoke Alarm
Exterior Features
Garage Carport:
Auto Garage Door Opener
Water Sewer:
Water District
Assigned School Information
School information is computer generated and may not be accurate or current. Buyer must independently verify and confirm enrollment. Please contact the school district to determine the schools to which this property is zoned.
Listing Broker: 1 - Connect Realty
Email Listing Broker
Selling Broker: Texas United Realty
Last updated as of: 07/11/2024
Property Tax
Market Value Per Appraisal District
Cost/Sqft based on Market Value
Tax Year
Cost/sqft
Market Value
Change
Tax Assessment
Change
2023
$177.77
$265,237
16.56% $265,237
16.56%
2022
$152.51
$227,550
28.22% $227,550
28.22%
2021
$118.95
$177,470
2.45% $177,470
2.45%
2020
$116.11
$173,230
4.68% $173,230
4.68%
2019
$110.92
$165,490
5.35% $165,490
5.35%
2018
$105.29
$157,090
1.17% $157,090
1.17%
2017
$104.07
$155,270
9.20% $155,270
9.20%
2016
$95.30
$142,190
0.22% $142,190
0.22%
2015
$95.09
$141,880
24.45% $141,880
24.45%
2014
$76.41
$114,010
2.76% $114,010
2.76%
2013
$74.36
$110,950
$110,950
2023 Fort Bend County Appraisal District Tax Value
Market Land Value:
$30,000
Market Improvement Value:
$235,237
Total Market Value : $265,237
2023 Tax Rates
FT BEND MUD 30:
0.4800 %
FORT BEND ISD:
0.9892 %
FT BEND CO GEN:
0.4265 %
FORT BEND DRNG:
0.0124 %
HARRIS-FT BEND ESD 100:
0.0853 %
Total Tax Rate : 1.9934 %