Sold Price Range: $285,001 - $325,000
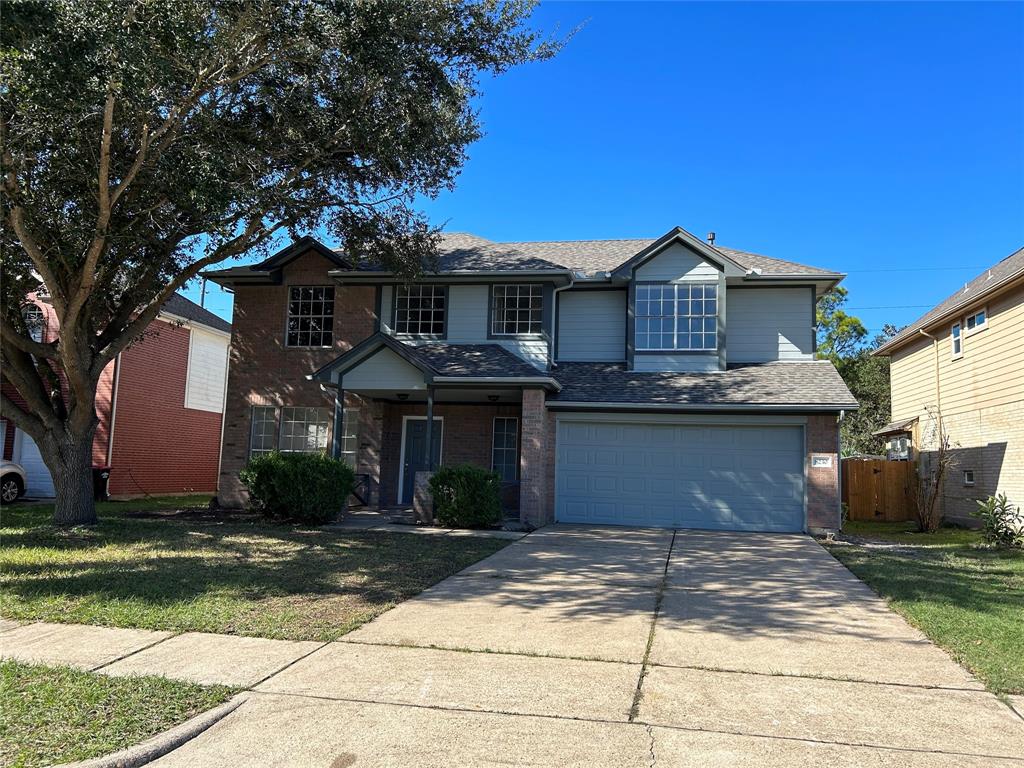
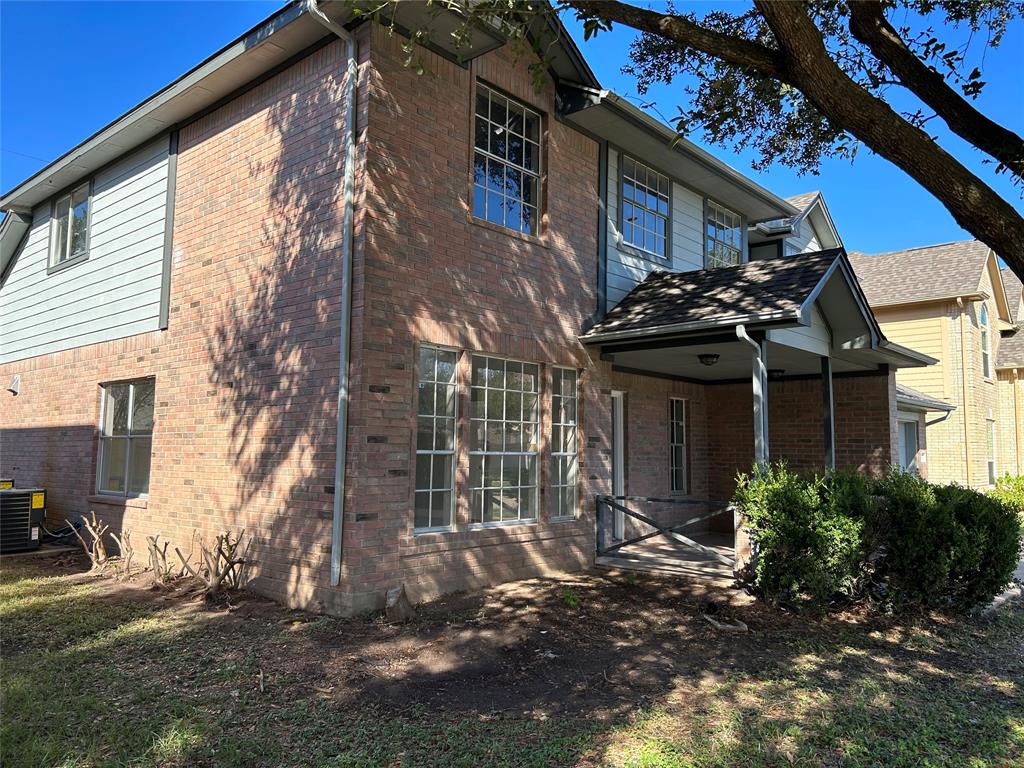
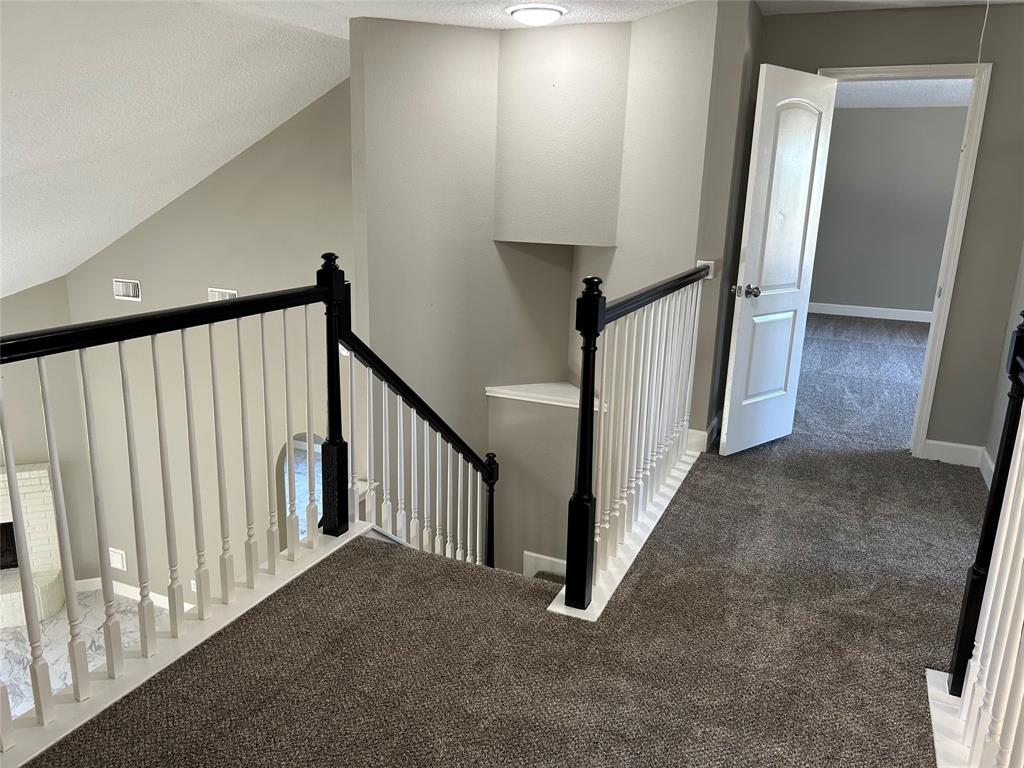
A beautifully remodeled house, walking distance to school, with all new roof 2022, 2 new exterior AC units, new tile floors, updated bathrooms, new paint, new fence, new quartz countertops, new appliances, all you wish in a house
Premium Content
Get full access to Premium Content
Sold Price for nearby listings,
Property History Reports and more.
Sign Up or
Log In Now
General Description
Sold Price Range:
$285,001 - $325,000
Address:
8230 Soledad Drive
Legal Description:
MISSION GLEN ESTATES SEC 6, BLOCK 2, LOT 8
Property Type:
Single-Family
Baths:
2 Full & 1 Half Bath(s)
Year Built:
1997 / Appraisal District
Building Sqft.:
3,312 308(m²) /Appraisal District
Lot Size:
6,510 Sqft. 605(m²) /Appraisal District
Maintenance Fee:
$ 450 / Annually
Ready to sell your home?
If you are considering selling your home, you may find out how now. Request your home selling analysis featuring Recently Sold, Market Analysis, Home Valuations and Market Update.
GET STARTED
Room Dimension
Primary Bedroom:
18x18, 1st
Interior Features
Fireplace:
2/Gas Connections
Bedroom Description:
Built-In Bunk Beds
Cooling:
Central Electric
Exterior Features
Lot Description:
Subdivision Lot
Water Sewer:
Water District
Unit Location:
Subdivision Lot
Assigned School Information
School information is computer generated and may not be accurate or current. Buyer must independently verify and confirm enrollment. Please contact the school district to determine the schools to which this property is zoned.
Listing Broker: Jabbour Realty
Email Listing Broker
Selling Broker: American Legacy Real Estate
Last updated as of: 06/30/2024
Property Tax
Market Value Per Appraisal District
Cost/Sqft based on Market Value
Tax Year
Cost/sqft
Market Value
Change
Tax Assessment
Change
2023
$112.34
$372,083
12.10% $372,083
31.26%
2022
$100.22
$331,920
28.80% $283,470
10.00%
2021
$77.81
$257,700
9.87% $257,700
9.87%
2020
$70.82
$234,550
7.13% $234,550
7.13%
2019
$66.10
$218,930
1.73% $218,930
1.73%
2018
$64.98
$215,200
8.96% $215,200
8.96%
2017
$59.63
$197,500
1.47% $197,500
8.08%
2016
$58.77
$194,640
9.53% $182,740
10.00%
2015
$53.65
$177,700
17.66% $166,130
10.00%
2014
$45.60
$151,030
7.10% $151,030
7.10%
2013
$42.58
$141,020
$141,020
2023 Fort Bend County Appraisal District Tax Value
Market Land Value:
$30,000
Market Improvement Value:
$342,083
Total Market Value : $372,083
2023 Tax Rates
FORT BEND ISD:
0.9892 %
FT BEND CO GEN:
0.4265 %
FORT BEND DRNG:
0.0124 %
HARRIS-FT BEND ESD 100:
0.0853 %
N MISSION GLEN MUD:
0.3900 %
WEST KEEGANS BAYOU IMP DIST:
0.0787 %
Total Tax Rate : 1.9821 %