Sold Price Range: $250,001 - $285,000
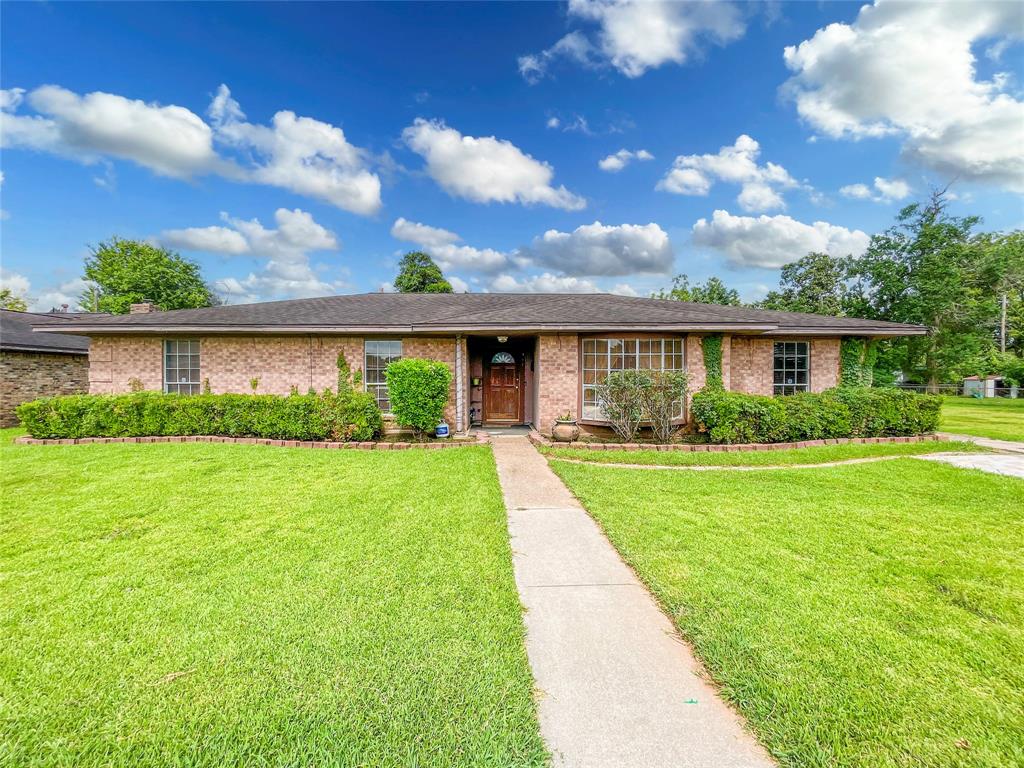
HIDDEN POTENTIAL! Check out this great property with great bones in a prime locations. This 3 bedroom 2 bath single story home can easily be transformed into a great income generating rental, investors flip, or your dream home. Don't miss the opportunity on your next investment, the sky's the limit!
Premium Content
Get full access to Premium Content
Sold Price for nearby listings,
Property History Reports and more.
Sign Up or
Log In Now
General Description
Sold Price Range:
$250,001 - $285,000
Legal Description:
MAYFIELD PARK SEC 2, BLOCK 2, LOT 11 & (N 1/2) LOT 12
Property Type:
Single-Family
Year Built:
1972 / Appraisal District
Building Sqft.:
1,988 185(m²) /Appraisal District
Lot Size:
8,628 Sqft. 802(m²) /Appraisal District
Ready to sell your home?
If you are considering selling your home, you may find out how now. Request your home selling analysis featuring Recently Sold, Market Analysis, Home Valuations and Market Update.
GET STARTED
Room Dimension
Primary Bedroom:
20X16, 1st
Interior Features
Bedroom Description:
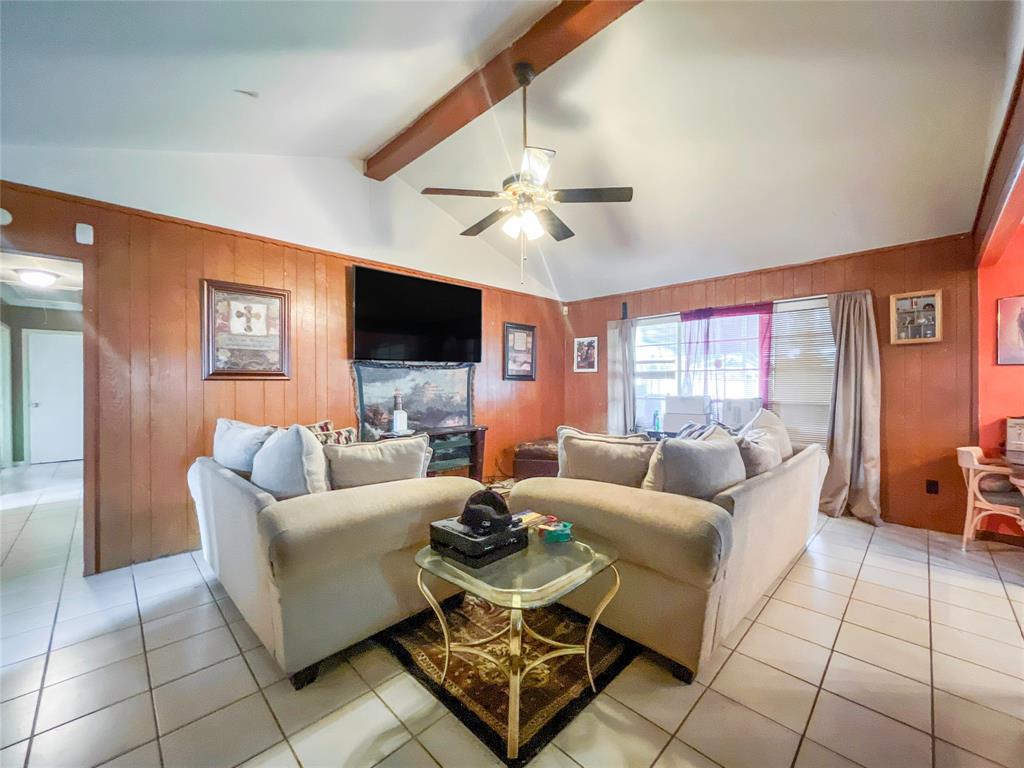
All Bedrooms Down
Room Description:
Family Room, Formal Living
Cooling:
Central Electric
Connections:
Electric Dryer Connections, Gas Dryer Connections, Washer Connections
Exterior Features
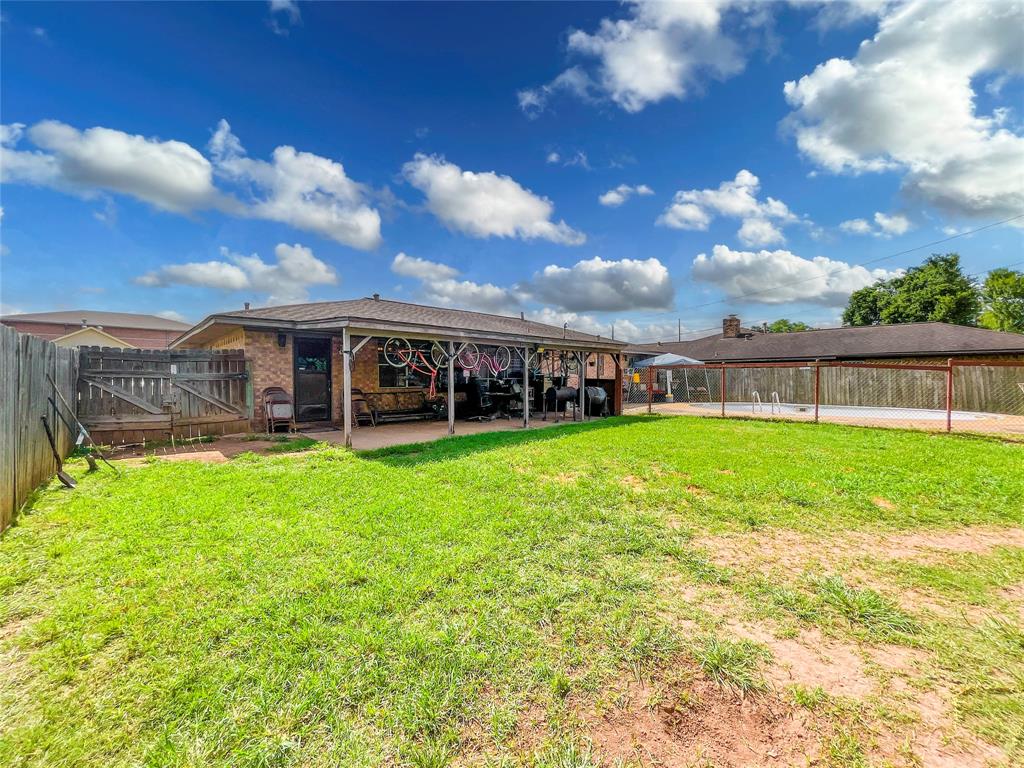
Private Pool Desc:
In Ground
Exterior Type:
Brick, Wood
Lot Description:
Subdivision Lot
Water Sewer:
Public Sewer, Public Water
Exterior:
Back Yard, Back Yard Fenced
Assigned School Information
School information is computer generated and may not be accurate or current. Buyer must independently verify and confirm enrollment. Please contact the school district to determine the schools to which this property is zoned.
Listing Broker: AEA Realty, LLC
Email Listing Broker
Selling Broker: Keller Williams Realty Southwest
Last updated as of: 07/12/2024
Property Tax
Market Value Per Appraisal District
Cost/Sqft based on Market Value
Tax Year
Cost/sqft
Market Value
Change
Tax Assessment
Change
2023
$226.77
$450,826
7.91% $220,616
10.00%
2022
$210.15
$417,770
48.57% $200,560
10.00%
2021
$141.44
$281,190
10.49% $182,330
10.00%
2020
$128.01
$254,490
5.10% $165,750
10.00%
2019
$121.80
$242,135
3.12% $150,680
10.00%
2018
$118.11
$234,805
60.00% $136,980
10.00%
2017
$73.82
$146,755
-0.20% $124,530
10.00%
2016
$73.97
$147,055
22.95% $113,210
10.00%
2015
$60.16
$119,605
27.83% $102,920
10.00%
2014
$47.06
$93,565
3.43% $93,565
3.43%
2013
$45.51
$90,465
$90,465
2023 Fort Bend County Appraisal District Tax Value
Market Land Value:
$95,450
Market Improvement Value:
$355,376
Total Market Value : $450,826
2023 Tax Rates
FORT BEND ISD:
0.9892 %
FT BEND CO GEN:
0.4265 %
FORT BEND DRNG:
0.0124 %
CITY OF SUGAR LAND:
0.3500 %
Total Tax Rate : 1.7781 %