Sold Price Range: $140,001 - $160,000
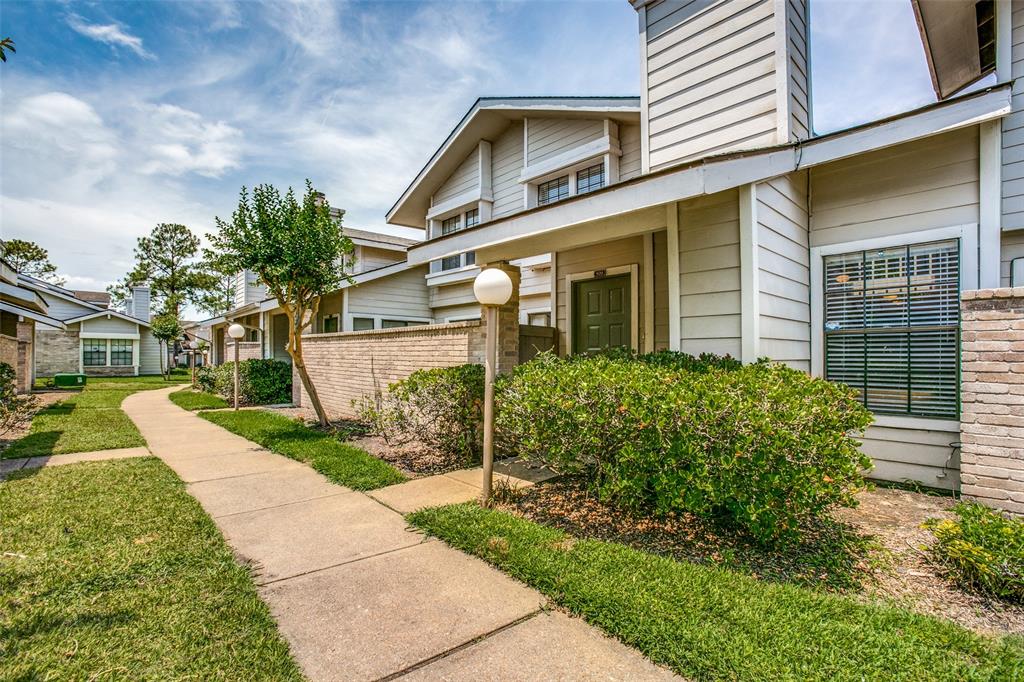
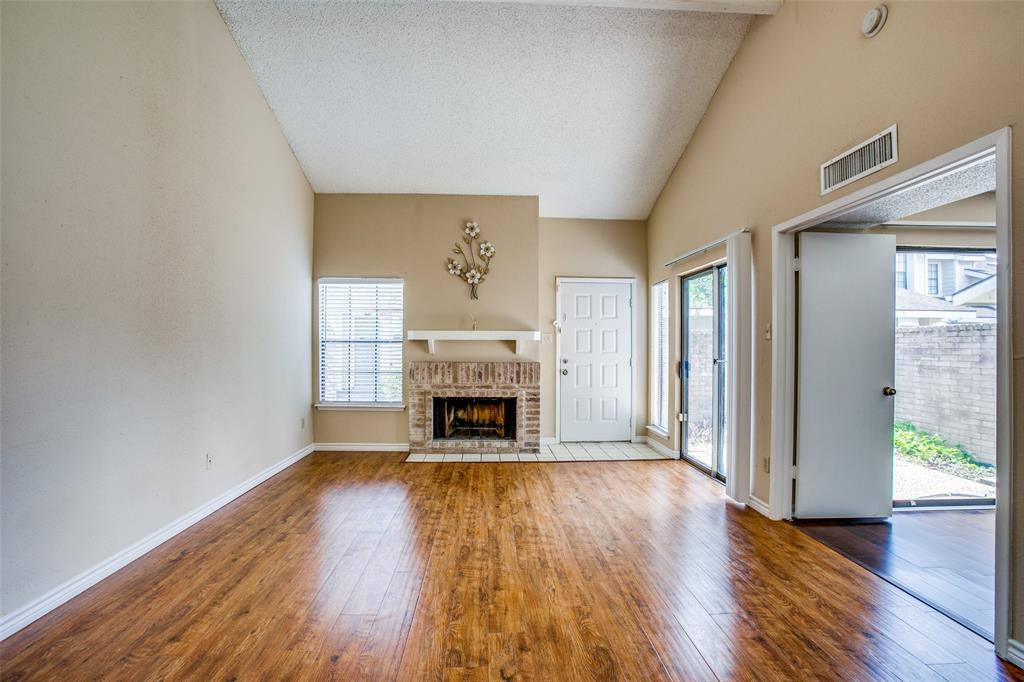
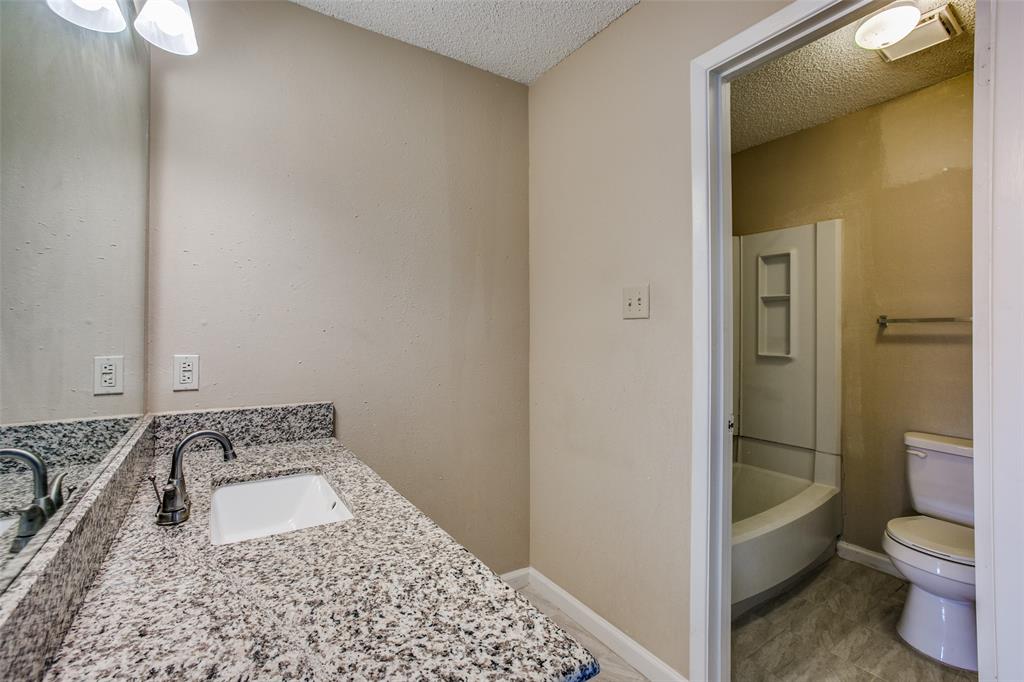
DID NOT FLOOD !!! Nice Townhouse!! Ready To move, 2 Beds and 2 baths, Relatively New Floor , paint, Cabinets, Granite in kitchen and baths, Many updates to the home.
Premium Content
Get full access to Premium Content
Sold Price for nearby listings,
Property History Reports and more.
Sign Up or
Log In Now
General Description
Sold Price Range:
$140,001 - $160,000
Address:
6217 Ludington Drive 20-920
Legal Description:
UNIT 920 BLDG 20 .00625 INT COMMON LAND & ELE FONDREN SW TEM
Property Type:
Townhouse/Condo - Townhouse
Year Built:
1983 / Appraisal District
Building Sqft.:
1,232 114(m²) /Appraisal District
Lot Size:
444,442 Sqft. 41,289(m²) /Appraisal District
Maintenance Fee:
$ 269 / Monthly
Ready to sell your home?
If you are considering selling your home, you may find out how now. Request your home selling analysis featuring Recently Sold, Market Analysis, Home Valuations and Market Update.
GET STARTED
Room Dimension
Primary Bedroom:
15x11, 1st
Utility Room Desc:
4x3, 1st
Interior Features
Room Description:
Gameroom Up, Living Area - 1st Floor
Bathroom Description:
Primary Bath: Soaking Tub
Bedroom Description:
1 Bedroom Up, Primary Bed - 1st Floor
Cooling:
Central Electric
Heating:
Central Electric
Appliances:
Electric Dryer Connection
Energy Feature:
Ceiling Fans
Interior:
Fire/Smoke Alarm, High Ceiling
Exterior Features
Exterior Type:
Brick, Wood
Water Sewer:
Public Sewer, Public Water
Assigned School Information
School information is computer generated and may not be accurate or current. Buyer must independently verify and confirm enrollment. Please contact the school district to determine the schools to which this property is zoned.
Listing Broker: Goldenlight Realty
Email Listing Broker
Selling Broker: H-Town Realty
Last updated as of: 07/18/2024
Property Tax
Market Value Per Appraisal District
Cost/Sqft based on Market Value
Tax Year
Cost/sqft
Market Value
Change
Tax Assessment
Change
2023
$112.43
$138,516
8.44% $138,516
39.44%
2022
$103.69
$127,741
41.45% $99,338
10.00%
2021
$73.30
$90,308
2.18% $90,308
7.91%
2020
$71.74
$88,379
16.17% $83,688
10.00%
2019
$61.75
$76,080
5.57% $76,080
5.57%
2018
$58.50
$72,068
14.41% $72,068
39.40%
2017
$51.13
$62,991
34.02% $51,700
10.00%
2016
$38.15
$47,000
-15.16% $47,000
-15.16%
2015
$44.97
$55,399
41.23% $55,399
41.23%
2014
$31.84
$39,227
0.00% $39,227
0.00%
2013
$31.84
$39,227
27.41% $39,227
27.41%
2012
$24.99
$30,787
$30,787
2023 Harris County Appraisal District Tax Value
Market Land Value:
$22,200
Market Improvement Value:
$116,316
Total Market Value : $138,516
2023 Tax Rates
HOUSTON ISD:
0.8683 %
HARRIS COUNTY:
0.3501 %
HC FLOOD CONTROL DIST:
0.0311 %
PORT OF HOUSTON AUTHORITY:
0.0057 %
HC HOSPITAL DIST:
0.1434 %
HC DEPARTMENT OF EDUCATION:
0.0048 %
HOUSTON COMMUNITY COLLEGE:
0.0922 %
HOUSTON CITY OF:
0.5192 %
HC ID 5:
0.1000 %
Total Tax Rate : 2.1148 %