Sold Price Range: $160,001 - $185,000
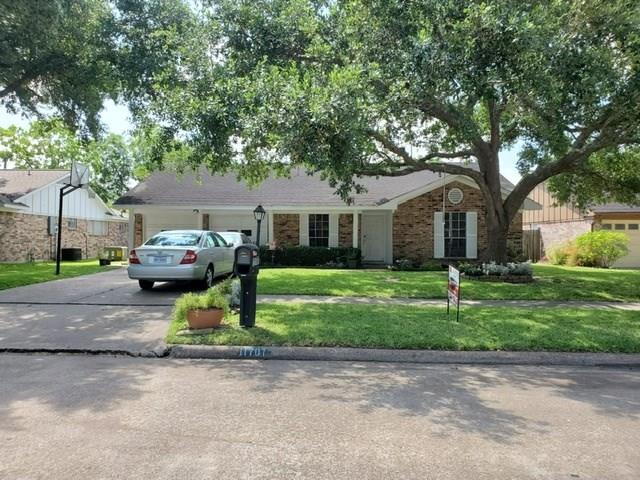
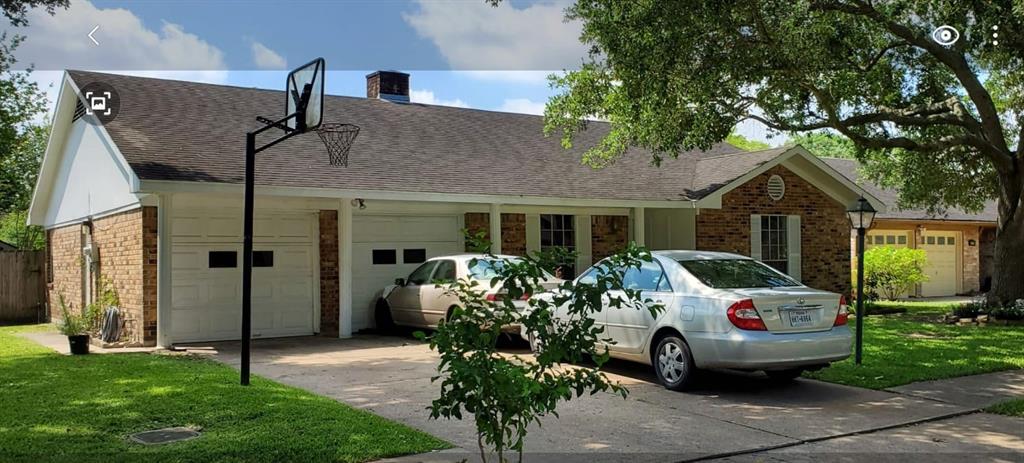
Spacious home in the very desirable Glenshire neighborhood. High ceilings in living area, kitchen with lots of storage space, recent paint, huge backyard. Conveniently located near Beltway 8, Hwy 59 and US90.
Premium Content
Get full access to Premium Content
Sold Price for nearby listings,
Property History Reports and more.
Sign Up or
Log In Now
General Description
Sold Price Range:
$160,001 - $185,000
Address:
11707 N Petersham Drive
Legal Description:
LT 2 BLK 7 GLENSHIRE SEC 1
Property Type:
Single-Family
Year Built:
1971 / Appraisal District
Building Sqft.:
1,643 153(m²) /Appraisal District
Lot Size:
7,713 Sqft. 717(m²) /Appraisal District
Maintenance Fee:
$ 450 / Annually
Ready to sell your home?
If you are considering selling your home, you may find out how now. Request your home selling analysis featuring Recently Sold, Market Analysis, Home Valuations and Market Update.
GET STARTED
Room Dimension
Primary Bedroom:
15x13, 1st
Interior Features
Kitchen Description:
Breakfast Bar
Room Description:
Breakfast Room, Formal Dining, Formal Living
Bedroom Description:
All Bedrooms Down
Cooling:
Central Electric
Exterior Features
Lot Description:
Subdivision Lot
Water Sewer:
Public Sewer, Public Water
Unit Location:
Subdivision Lot
Exterior:
Back Yard Fenced
Assigned School Information
School information is computer generated and may not be accurate or current. Buyer must independently verify and confirm enrollment. Please contact the school district to determine the schools to which this property is zoned.
Listing Broker: Champions Real Estate Group
Email Listing Broker
Selling Broker: Maxima Realty
Last updated as of: 07/18/2024
Property Tax
Market Value Per Appraisal District
Cost/Sqft based on Market Value
Tax Year
Cost/sqft
Market Value
Change
Tax Assessment
Change
2023
$142.50
$234,126
14.72% $234,126
14.72%
2022
$124.21
$204,080
16.95% $204,080
16.95%
2021
$106.21
$174,503
11.75% $174,503
11.75%
2020
$95.04
$156,150
3.54% $156,150
3.54%
2019
$91.79
$150,818
5.19% $150,818
5.19%
2018
$87.26
$143,376
0.00% $143,376
0.00%
2017
$87.26
$143,376
-1.00% $143,376
-1.00%
2016
$88.15
$144,826
7.52% $144,826
8.34%
2015
$81.99
$134,703
10.84% $133,683
10.00%
2014
$73.97
$121,530
15.58% $121,530
15.58%
2013
$64.00
$105,150
-5.57% $105,150
-5.57%
2012
$67.78
$111,355
$111,355
2023 Harris County Appraisal District Tax Value
Market Land Value:
$50,135
Market Improvement Value:
$183,991
Total Market Value : $234,126
2023 Tax Rates
HOUSTON ISD:
0.8683 %
HARRIS COUNTY:
0.3501 %
HC FLOOD CONTROL DIST:
0.0311 %
PORT OF HOUSTON AUTHORITY:
0.0057 %
HC HOSPITAL DIST:
0.1434 %
HC DEPARTMENT OF EDUCATION:
0.0048 %
HOUSTON COMMUNITY COLLEGE:
0.0922 %
HOUSTON CITY OF:
0.5192 %
HC ID 5:
0.1000 %
Total Tax Rate : 2.1148 %