Sold Price Range: $250,001 - $285,000
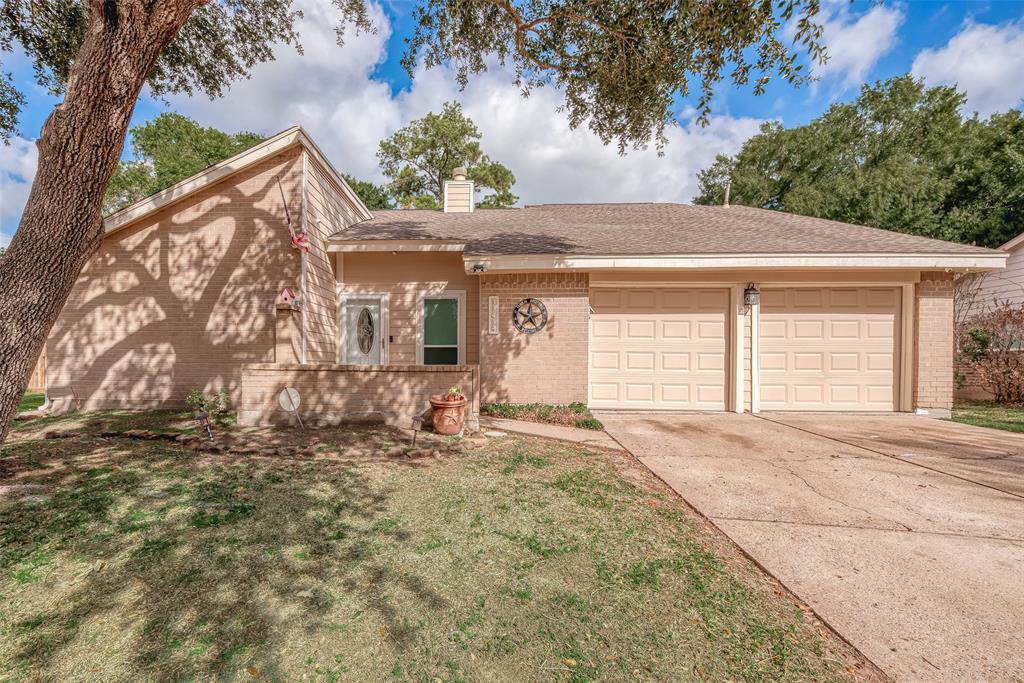
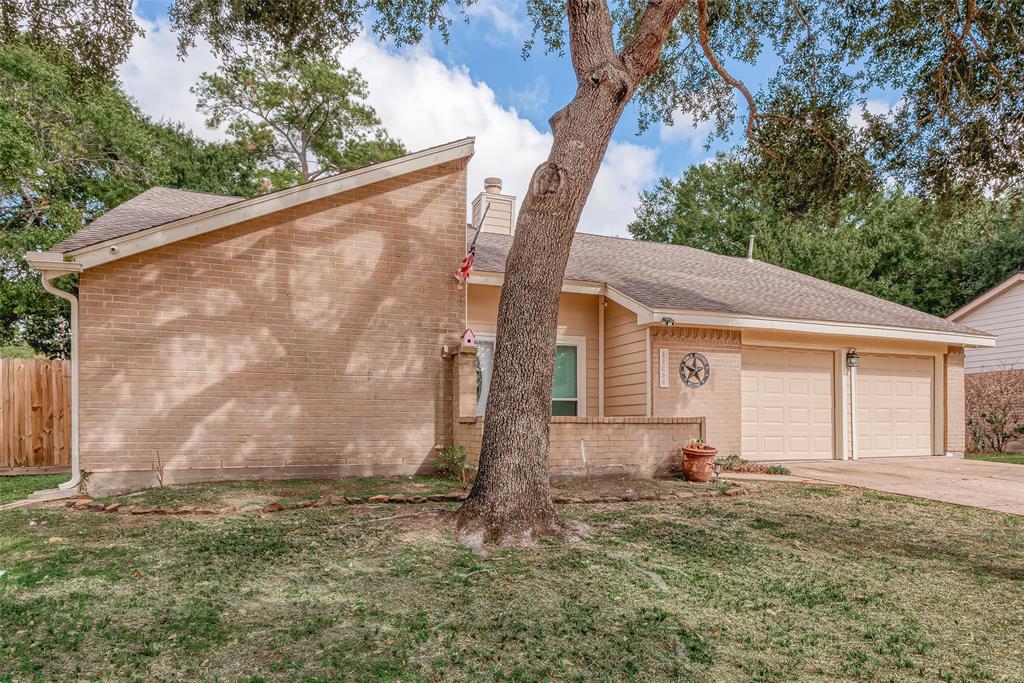
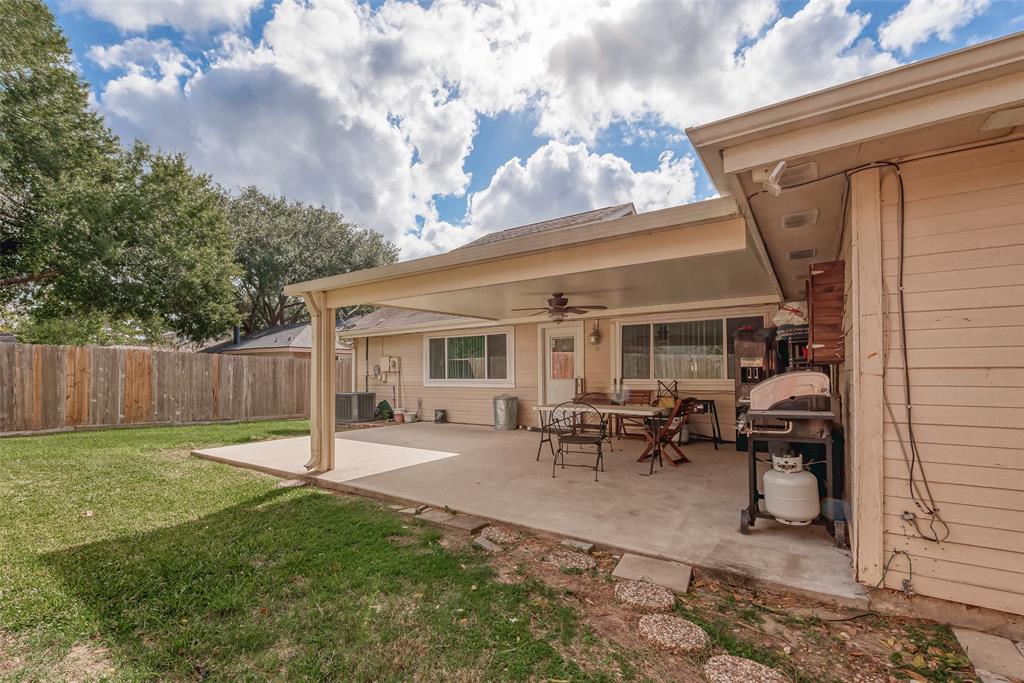
Wonderful home in an established community. The home occupies a large backyard with plenty of space. The backyard is built for entertaining with a covered patio. Don't miss your chance to get into this amazing neighborhood, there are 2 community pools, tennis courts, a basketball court, and a clubhouse.
Premium Content
Get full access to Premium Content
Sold Price for nearby listings,
Property History Reports and more.
Sign Up or
Log In Now
General Description
Sold Price Range:
$250,001 - $285,000
Address:
13434 Nevermore Dr
Legal Description:
LT 35 BLK 4 RAVENSWAY SOUTH
Property Type:
Single-Family
Year Built:
1982 / Appraisal District
Building Sqft.:
2,186 203(m²) /Appraisal District
Lot Size:
9,675 Sqft. 899(m²) /Appraisal District
Maintenance Fee:
$ 650 / Annually
Ready to sell your home?
If you are considering selling your home, you may find out how now. Request your home selling analysis featuring Recently Sold, Market Analysis, Home Valuations and Market Update.
GET STARTED
Room Dimension
Primary Bedroom:
15X13, 1st
Home Office/Study:
10X11, 1st
Interior Features
Bedroom Description:
All Bedrooms Down
Cooling:
Central Electric
Exterior Features
Lot Description:
Subdivision Lot
Water Sewer:
Water District
Assigned School Information
School information is computer generated and may not be accurate or current. Buyer must independently verify and confirm enrollment. Please contact the school district to determine the schools to which this property is zoned.
Listing Broker: REALM Real Estate Professionals - Sugar Land
Email Listing Broker
Selling Broker: Keller Williams Realty Professionals
Last updated as of: 07/19/2024
Property Tax
Market Value Per Appraisal District
Cost/Sqft based on Market Value
Tax Year
Cost/sqft
Market Value
Change
Tax Assessment
Change
2023
$126.12
$275,703
11.03% $273,154
10.00%
2022
$113.60
$248,322
18.84% $248,322
22.19%
2021
$95.59
$208,959
13.11% $203,218
10.00%
2020
$84.51
$184,744
3.90% $184,744
3.90%
2019
$81.34
$177,807
3.42% $177,807
3.42%
2018
$78.65
$171,931
0.00% $171,931
0.00%
2017
$78.65
$171,931
5.73% $171,931
5.73%
2016
$74.39
$162,617
4.00% $162,617
25.93%
2015
$71.53
$156,369
25.10% $129,137
3.31%
2014
$57.18
$125,000
0.00% $125,000
0.00%
2013
$57.18
$125,000
0.00% $125,000
0.00%
2012
$57.18
$125,000
$125,000
2023 Harris County Appraisal District Tax Value
Market Land Value:
$69,374
Market Improvement Value:
$206,329
Total Market Value : $275,703
2023 Tax Rates
CYPRESS-FAIRBANKS ISD:
1.0811 %
HARRIS COUNTY:
0.3501 %
HC FLOOD CONTROL DIST:
0.0311 %
PORT OF HOUSTON AUTHORITY:
0.0057 %
HC HOSPITAL DIST:
0.1434 %
HC DEPARTMENT OF EDUCATION:
0.0048 %
LONE STAR COLLEGE SYS:
0.1076 %
HC EMERG SRV DIST 13:
0.0919 %
HC EMERG SRV DIST 11:
0.0302 %
TIMBERLAKE ID:
0.3800 %
Total Tax Rate : 2.2258 %