Sold Price Range: $140,001 - $160,000
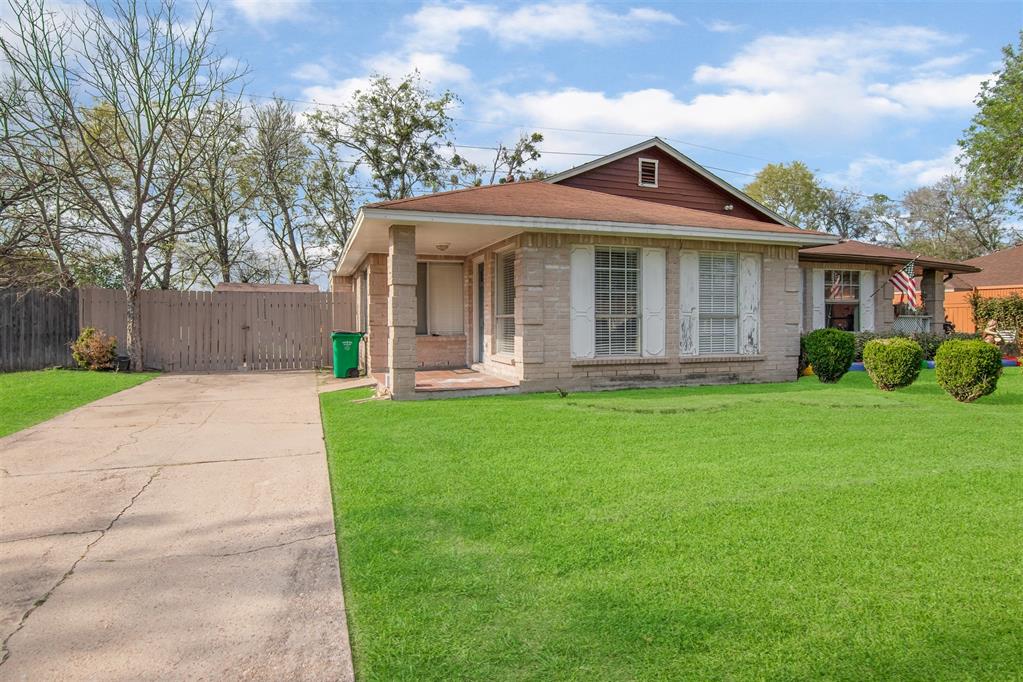
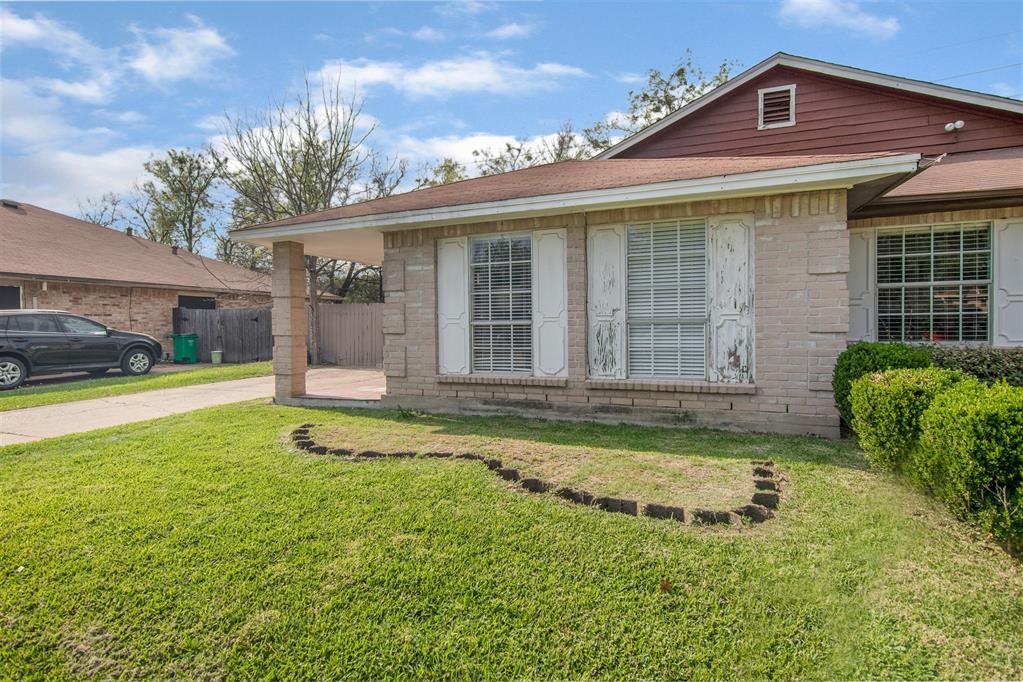
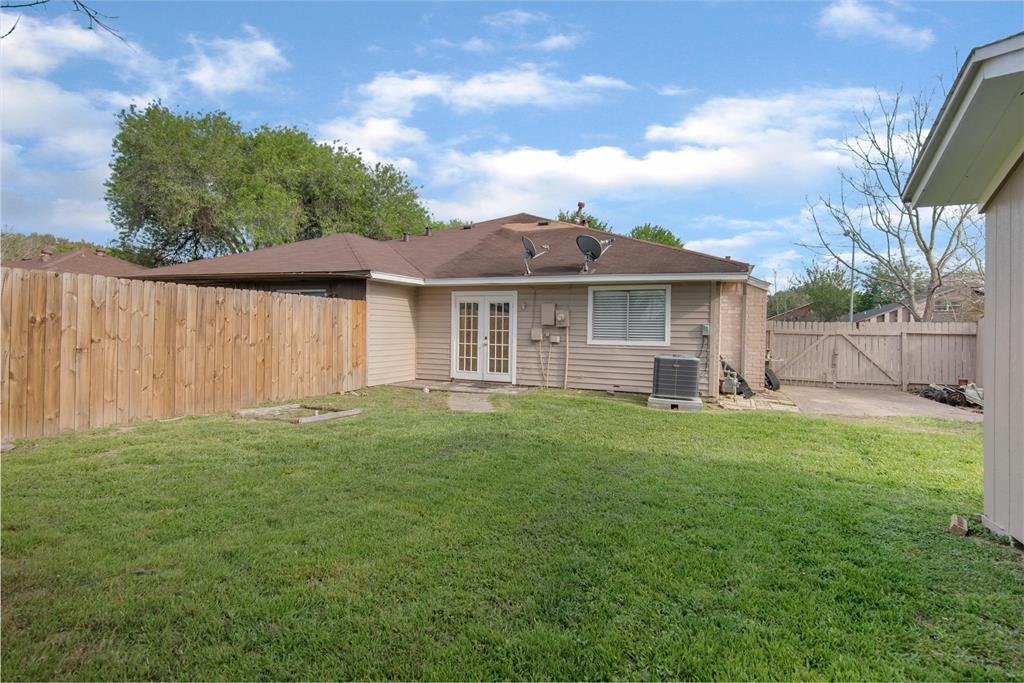
Welcome home! Conveniently located near Westpark Tollway, 99 & Highway 6. Charming 2-bedroom 1-bath home features updated interior paint, tile floors throughout, crown molding, and updated bathroom and kitchen. Spacious Primary Suite w/ walk in closet. Call to schedule your showing today!
Premium Content
Get full access to Premium Content
Sold Price for nearby listings,
Property History Reports and more.
Sign Up or
Log In Now
General Description
Sold Price Range:
$140,001 - $160,000
Address:
17012 Mercado Drive
Legal Description:
MISSION WEST SEC 2, BLOCK 1, LOT 11-B (SW 1/2)
Property Type:
Single-Family
Year Built:
1982 / Appraisal District
Building Sqft.:
887 82(m²) /Appraisal District
Lot Size:
4,331 Sqft. 402(m²) /Appraisal District
Maintenance Fee:
$ 300 / Annually
Ready to sell your home?
If you are considering selling your home, you may find out how now. Request your home selling analysis featuring Recently Sold, Market Analysis, Home Valuations and Market Update.
GET STARTED
Interior Features
Bedroom Description:
All Bedrooms Down
Room Description:
1 Living Area, Utility Room in House
Cooling:
Central Electric
Connections:
Electric Dryer Connections
Energy Feature:
Ceiling Fans
Exterior Features
Exterior Type:
Brick, Wood
Lot Description:
Subdivision Lot
Garage Carport:
Driveway Gate
Water Sewer:
Water District
Unit Location:
Subdivision Lot
Assigned School Information
School information is computer generated and may not be accurate or current. Buyer must independently verify and confirm enrollment. Please contact the school district to determine the schools to which this property is zoned.
Listing Broker: Keller Williams RealtyNortheast
Email Listing Broker
Selling Broker: Lenore Smith Realty Group, Inc
Last updated as of: 07/05/2024
Property Tax
Market Value Per Appraisal District
Cost/Sqft based on Market Value
Tax Year
Cost/sqft
Market Value
Change
Tax Assessment
Change
2023
$139.60
$123,821
10.88% $123,821
10.88%
2022
$125.90
$111,670
16.59% $111,670
16.59%
2021
$107.98
$95,780
17.44% $95,780
17.44%
2020
$91.95
$81,560
18.05% $81,560
18.05%
2019
$77.89
$69,090
14.39% $69,090
14.39%
2018
$68.09
$60,400
-0.23% $60,400
-0.23%
2017
$68.25
$60,540
0.78% $60,540
0.78%
2016
$67.72
$60,070
9.36% $60,070
9.36%
2015
$61.93
$54,930
38.15% $54,930
38.15%
2014
$44.83
$39,760
2.79% $39,760
2.79%
2013
$43.61
$38,680
$38,680
2023 Fort Bend County Appraisal District Tax Value
Market Land Value:
$21,150
Market Improvement Value:
$102,671
Total Market Value : $123,821
2023 Tax Rates
FT BEND MUD 30:
0.4800 %
FORT BEND ISD:
0.9892 %
FT BEND CO GEN:
0.4265 %
FORT BEND DRNG:
0.0124 %
HARRIS-FT BEND ESD 100:
0.0853 %
Total Tax Rate : 1.9934 %