Sold Price Range: $140,001 - $160,000
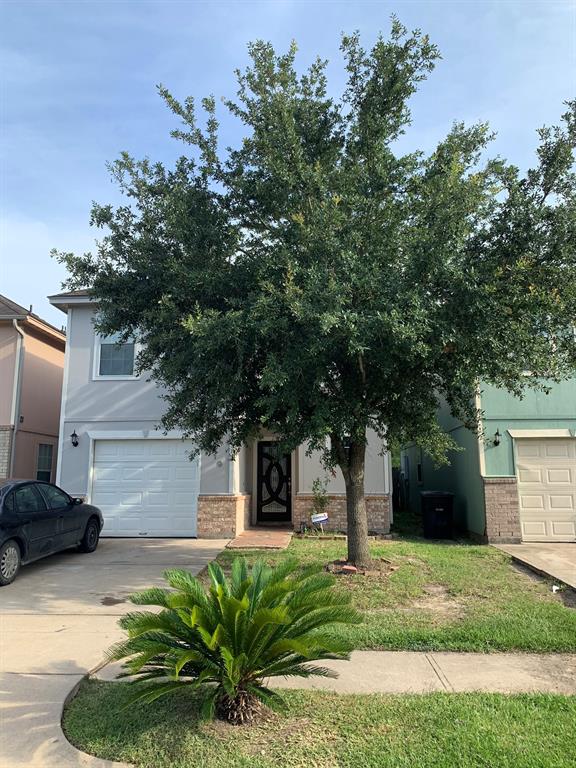
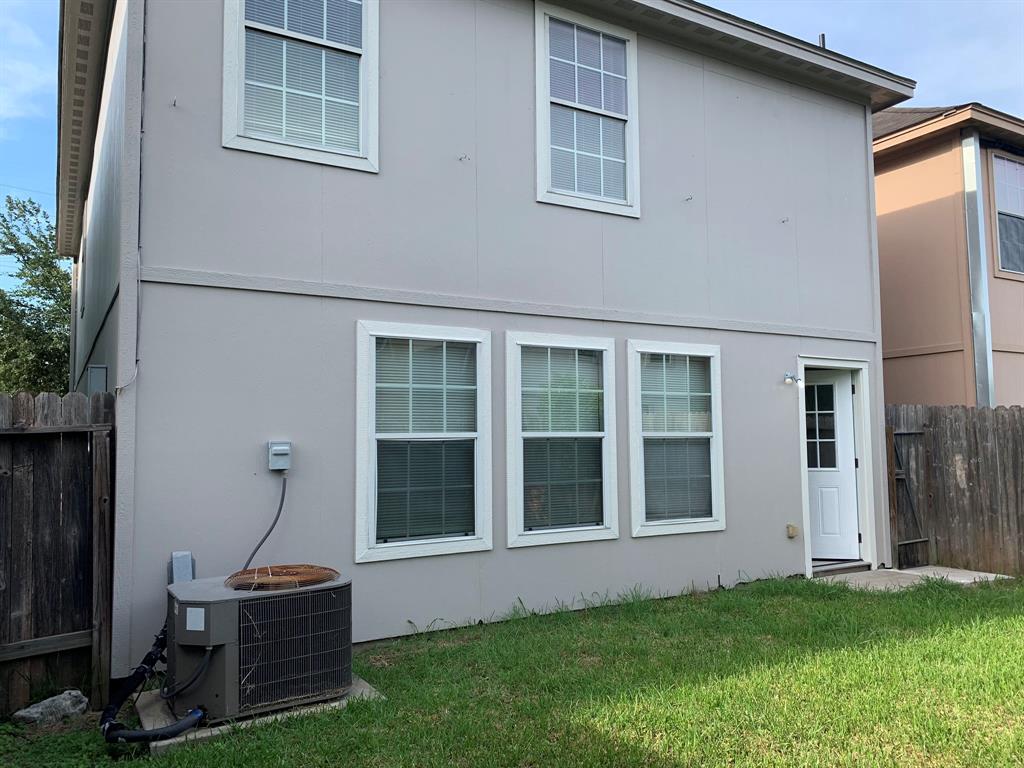
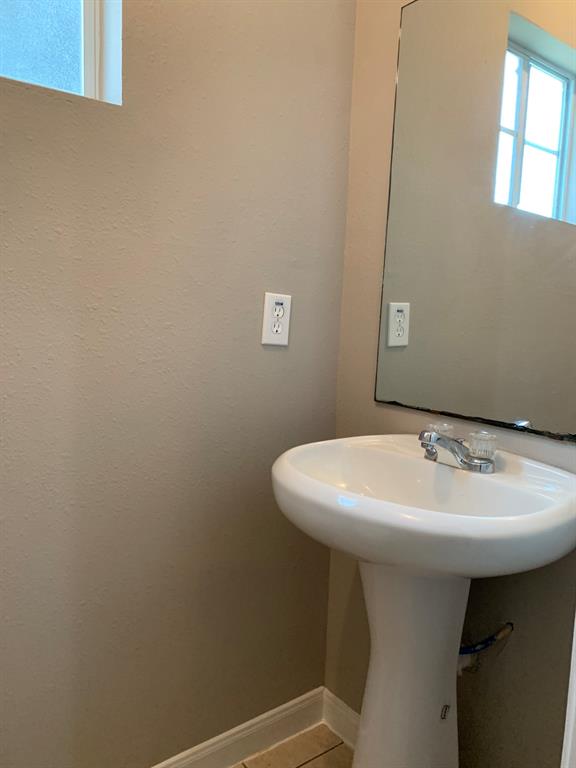
4/2.5 Ready to move in home with nice tile and wood laminate floor...Home has fresh paint interior and exterior...New set of SS appliances: Dishwasher, Range, Microwave, and Refrigerator....Beautiful upgraded front and back doors...Double pan windows to keep the cold inside. Easy access to Beltway 8 and 610. It's a great starter home...Get your appointment TODAY!
Premium Content
Get full access to Premium Content
Sold Price for nearby listings,
Property History Reports and more.
Sign Up or
Log In Now
General Description
Sold Price Range:
$140,001 - $160,000
Address:
4919 N Cancun Drive
Legal Description:
LT 12 BLK 1 SUNSET BEND SEC 1 R/P
Property Type:
Single-Family
Baths:
2 Full & 1 Half Bath(s)
Year Built:
2007 / Appraisal District
Building Sqft.:
1,700 158(m²) /Appraisal District
Lot Size:
2,520 Sqft. 234(m²) /Appraisal District
Maintenance Fee:
$ 200 / Annually
Ready to sell your home?
If you are considering selling your home, you may find out how now. Request your home selling analysis featuring Recently Sold, Market Analysis, Home Valuations and Market Update.
GET STARTED
Room Dimension
Primary Bedroom:
16x14, 2nd
Interior Features
Bedroom Description:
All Bedrooms Up
Cooling:
Central Electric
Connections:
Electric Dryer Connections, Washer Connections
Interior:
Alarm System - Owned
Exterior Features
Lot Description:
Subdivision Lot
Water Sewer:
Public Water
Unit Location:
Subdivision Lot
Assigned School Information
School information is computer generated and may not be accurate or current. Buyer must independently verify and confirm enrollment. Please contact the school district to determine the schools to which this property is zoned.
Listing Broker: Predictable Realty LLC
Email Listing Broker
Selling Broker: Century 21 Olympian Area Specialists
Last updated as of: 07/05/2024
Property Tax
Market Value Per Appraisal District
Cost/Sqft based on Market Value
Tax Year
Cost/sqft
Market Value
Change
Tax Assessment
Change
2023
$115.27
$195,951
7.13% $195,951
7.13%
2022
$107.59
$182,906
11.33% $182,906
11.33%
2021
$96.64
$164,291
0.00% $164,291
0.00%
2020
$96.64
$164,291
95.09% $164,291
95.09%
2019
$49.54
$84,211
0.00% $84,211
0.00%
2018
$49.54
$84,211
0.00% $84,211
0.00%
2017
$49.54
$84,211
0.00% $84,211
0.00%
2016
$49.54
$84,211
0.00% $84,211
0.00%
2015
$49.54
$84,211
-21.43% $84,211
-21.43%
2014
$63.04
$107,175
0.00% $107,175
0.00%
2013
$63.04
$107,175
0.00% $107,175
0.00%
2012
$63.04
$107,175
$107,175
2023 Harris County Appraisal District Tax Value
Market Land Value:
$15,422
Market Improvement Value:
$180,529
Total Market Value : $195,951
2023 Tax Rates
HOUSTON ISD:
0.8683 %
HARRIS COUNTY:
0.3501 %
HC FLOOD CONTROL DIST:
0.0311 %
PORT OF HOUSTON AUTHORITY:
0.0057 %
HC HOSPITAL DIST:
0.1434 %
HC DEPARTMENT OF EDUCATION:
0.0048 %
HOUSTON COMMUNITY COLLEGE:
0.0922 %
HOUSTON CITY OF:
0.5192 %
FIVE CORNERS IMPR DISTRICT:
0.1000 %
Total Tax Rate : 2.1148 %