Sold Price Range: $285,001 - $325,000
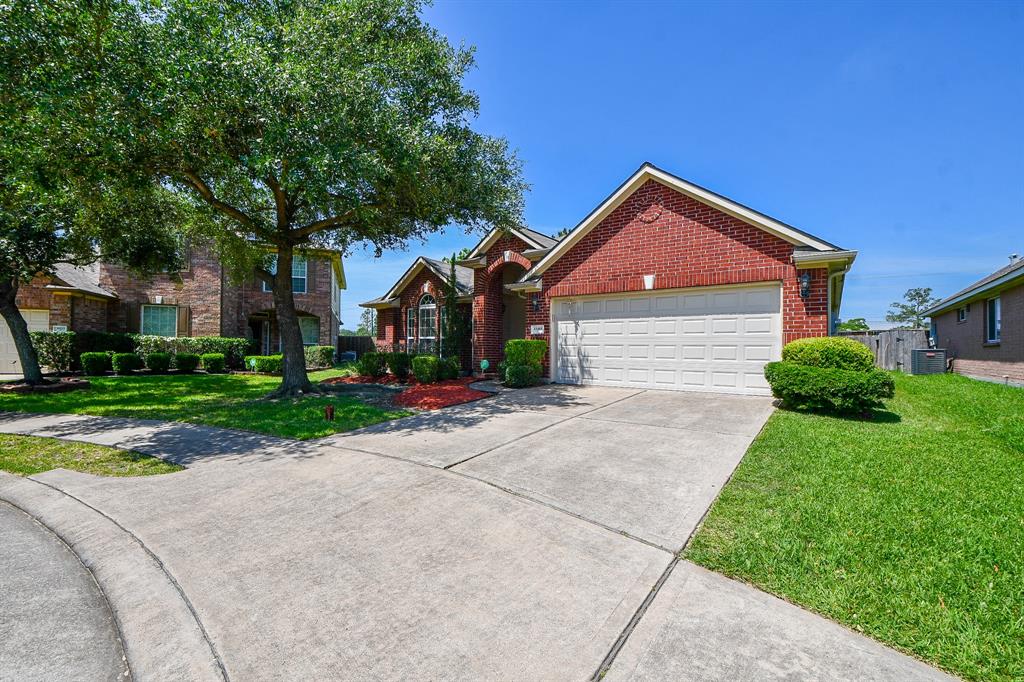
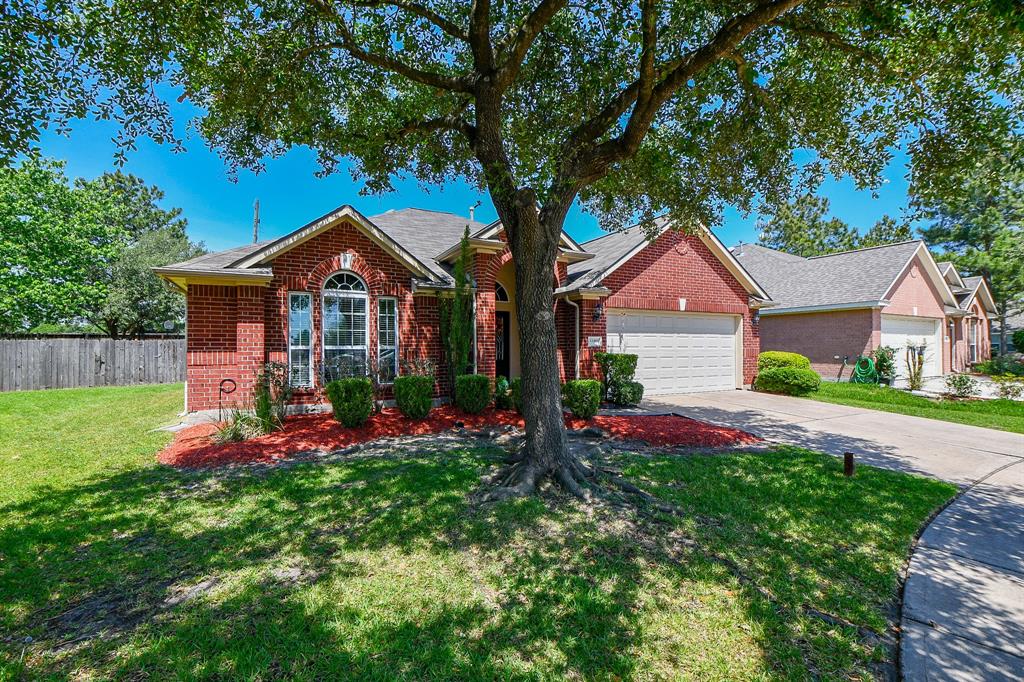
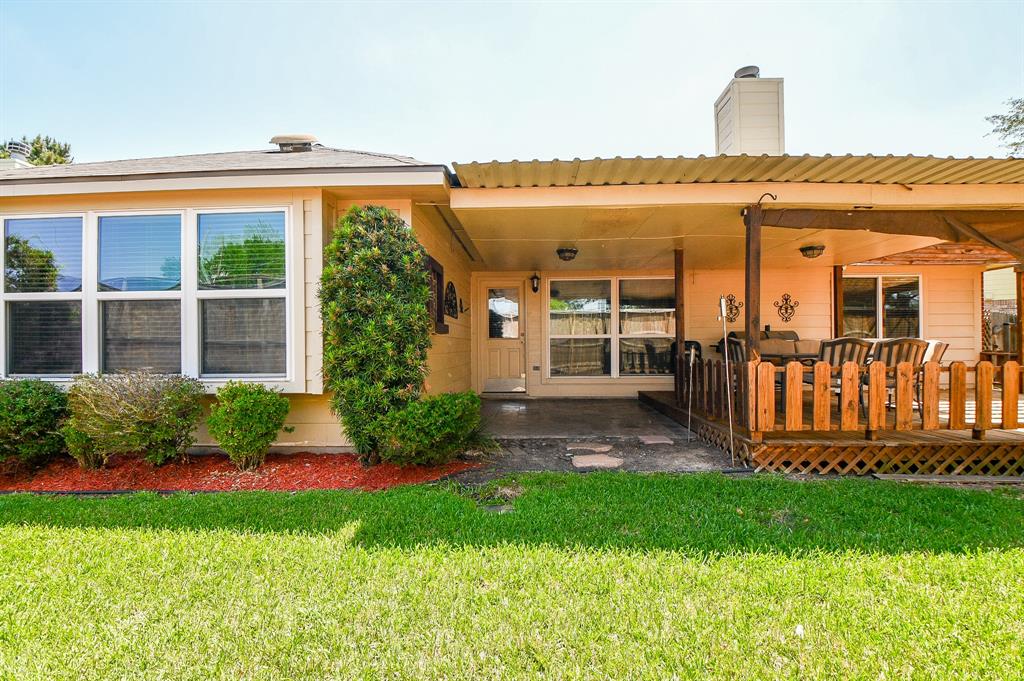
Great 1 story 3 bedrooms, 2 baths + study. Upgrades include porcelain tile entry way, kitchen, living room & baths. Kitchen has 42 inch cabinets w/Granite counter tops & large island. The back yard has a large covered deck and is landscaped. This is a great house at an excellent price point.
Premium Content
Get full access to Premium Content
Sold Price for nearby listings,
Property History Reports and more.
Sign Up or
Log In Now
General Description
Sold Price Range:
$285,001 - $325,000
Address:
12403 Blinnwood Lane
Legal Description:
LT 2 BLK 1 LINNFIELD SEC 2
Property Type:
Single-Family
Style:
Contemporary/Modern
Year Built:
2004 / Appraisal District
Building Sqft.:
2,170 202(m²) /Appraisal District
Lot Size:
7,655 Sqft. 711(m²) /Appraisal District
Maintenance Fee:
$ 450 / Annually
Ready to sell your home?
If you are considering selling your home, you may find out how now. Request your home selling analysis featuring Recently Sold, Market Analysis, Home Valuations and Market Update.
GET STARTED
Room Dimension
Primary Bedroom:
15x14, 1st
Home Office/Study:
10x14, 1st
Interior Features
Bathroom Description:
Primary Bath: Double Sinks
Bedroom Description:
All Bedrooms Down
Room Description:
Breakfast Room, Den
Cooling:
Central Electric
Interior:
Alarm System - Leased
Exterior Features
Garage Carport:
Auto Garage Door Opener
Water Sewer:
Water District
Exterior:
Covered Patio/Deck
Assigned School Information
School information is computer generated and may not be accurate or current. Buyer must independently verify and confirm enrollment. Please contact the school district to determine the schools to which this property is zoned.
Listing Broker: REALM Real Estate Professional
Email Listing Broker
Selling Broker: eXp Realty LLC
Last updated as of: 07/05/2024
Property Tax
Market Value Per Appraisal District
Cost/Sqft based on Market Value
Tax Year
Cost/sqft
Market Value
Change
Tax Assessment
Change
2023
$142.78
$309,828
13.08% $309,828
22.29%
2022
$126.26
$273,986
17.21% $253,350
10.00%
2021
$107.72
$233,762
11.64% $230,319
10.00%
2020
$96.49
$209,381
2.66% $209,381
2.66%
2019
$93.99
$203,952
4.65% $203,952
4.65%
2018
$89.81
$194,892
0.00% $194,892
0.00%
2017
$89.81
$194,892
4.29% $194,892
4.29%
2016
$86.12
$186,876
7.36% $186,876
7.36%
2015
$80.21
$174,060
13.78% $174,060
19.80%
2014
$70.50
$152,977
15.82% $145,293
10.00%
2013
$60.87
$132,085
0.00% $132,085
0.00%
2012
$60.87
$132,085
$132,085
2023 Harris County Appraisal District Tax Value
Market Land Value:
$58,379
Market Improvement Value:
$251,449
Total Market Value : $309,828
2023 Tax Rates
CYPRESS-FAIRBANKS ISD:
1.0811 %
HARRIS COUNTY:
0.3501 %
HC FLOOD CONTROL DIST:
0.0311 %
PORT OF HOUSTON AUTHORITY:
0.0057 %
HC HOSPITAL DIST:
0.1434 %
HC DEPARTMENT OF EDUCATION:
0.0048 %
LONE STAR COLLEGE SYS:
0.1076 %
EMERALD FOREST UD:
0.6150 %
HC EMERG SRV DIST 13:
0.0919 %
HC EMERG SRV DIST 11:
0.0302 %
Total Tax Rate : 2.4608 %