Sold Price Range: $215,001 - $250,000
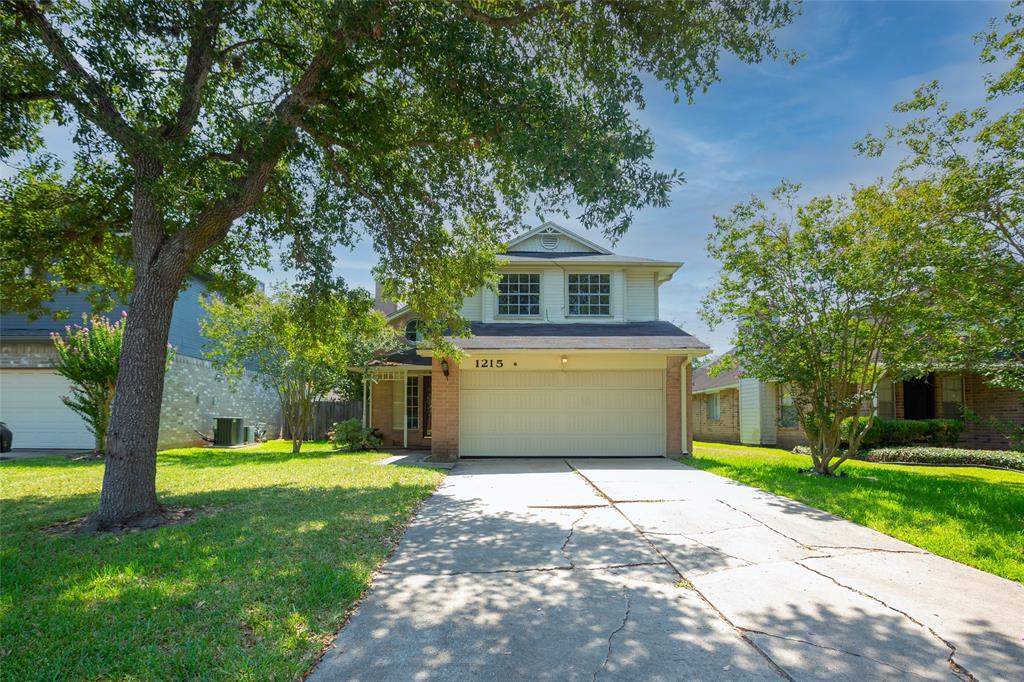
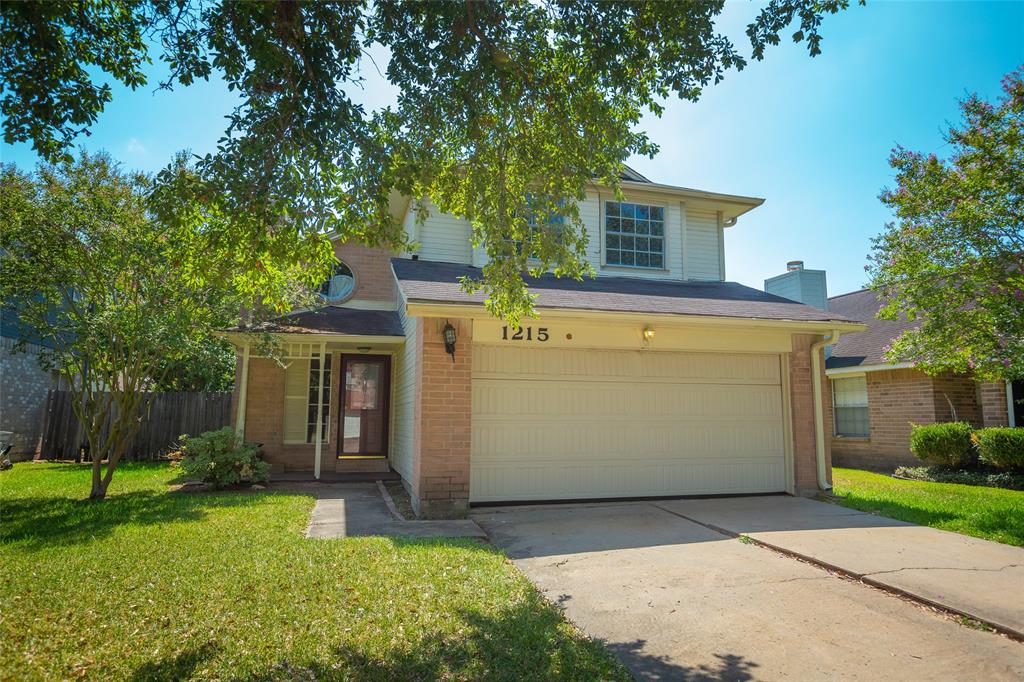
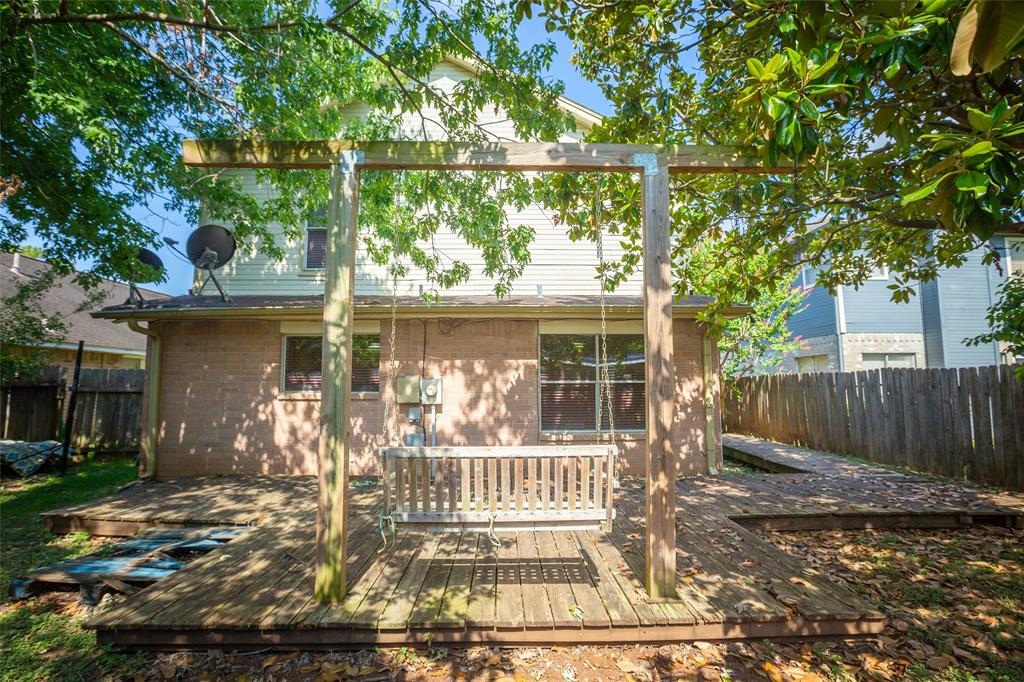
Charming 2 story 3 bedroom, 2 and half bath with porches, patios, & a balcony all surrounded by lush landscaping. High ceiling with formal living area features wet bar & fireplace with beautiful oversized mantle. Kitchen loaded with cabinet space & has window open to Den. Large primary bedroom has a balcony opens to backyard. Great locationl with great value!! Conveniently close to everything: Sugar Land First Colony mall, highway 90, highway 59, Highway 6, Beltway 8 etc...Coming to see it today!
Premium Content
Get full access to Premium Content
Sold Price for nearby listings,
Property History Reports and more.
Sign Up or
Log In Now
General Description
Sold Price Range:
$215,001 - $250,000
Address:
1215 Birchstone Drive
Legal Description:
LEXINGTON SETTLEMENT SEC 1, BLOCK 2, LOT 9
Property Type:
Single-Family
Baths:
2 Full & 1 Half Bath(s)
Year Built:
1984 / Appraisal District
Building Sqft.:
2,019 188(m²) /Appraisal District
Lot Size:
5,495 Sqft. 510(m²) /Appraisal District
Maintenance Fee:
$ 300 / Annually
Room Dimension
Primary Bedroom:
17x15, 2nd
Interior Features
Cooling:
Central Electric
Exterior Features
Exterior Type:
Brick, Cement Board
Lot Description:
Subdivision Lot
Water Sewer:
Public Sewer, Public Water
Unit Location:
Subdivision Lot
Assigned School Information
School information is computer generated and may not be accurate or current. Buyer must independently verify and confirm enrollment. Please contact the school district to determine the schools to which this property is zoned.
Listing Broker: REALM Real Estate Professional
Email Listing Broker
Selling Broker: LV Realty & Services
Last updated as of: 07/11/2024
Property Tax
Market Value Per Appraisal District
Cost/Sqft based on Market Value
Tax Year
Cost/sqft
Market Value
Change
Tax Assessment
Change
2023
$131.81
$266,132
1.28% $266,132
1.28%
2022
$130.15
$262,780
38.89% $262,780
38.89%
2021
$93.71
$189,200
11.43% $189,200
11.43%
2020
$84.10
$169,790
0.05% $169,790
0.05%
2019
$84.05
$169,700
1.69% $169,700
1.69%
2018
$82.65
$166,880
0.89% $166,880
0.89%
2017
$81.93
$165,410
6.04% $165,410
6.04%
2016
$77.26
$155,990
5.83% $155,990
9.67%
2015
$73.00
$147,390
13.98% $142,240
10.00%
2014
$64.05
$129,310
2.85% $129,310
2.85%
2013
$62.27
$125,730
$125,730
2023 Fort Bend County Appraisal District Tax Value
Market Land Value:
$27,740
Market Improvement Value:
$238,392
Total Market Value : $266,132
2023 Tax Rates
FORT BEND ISD:
0.9892 %
HCC MISSOURI CITY:
0.0922 %
CITY OF MISSOURI CITY:
0.5708 %
FT BEND MUD 42:
0.3100 %
FT BEND CO GEN:
0.4265 %
FORT BEND DRNG:
0.0124 %
Total Tax Rate : 2.4012 %