Sold Price Range: $370,001 - $420,000
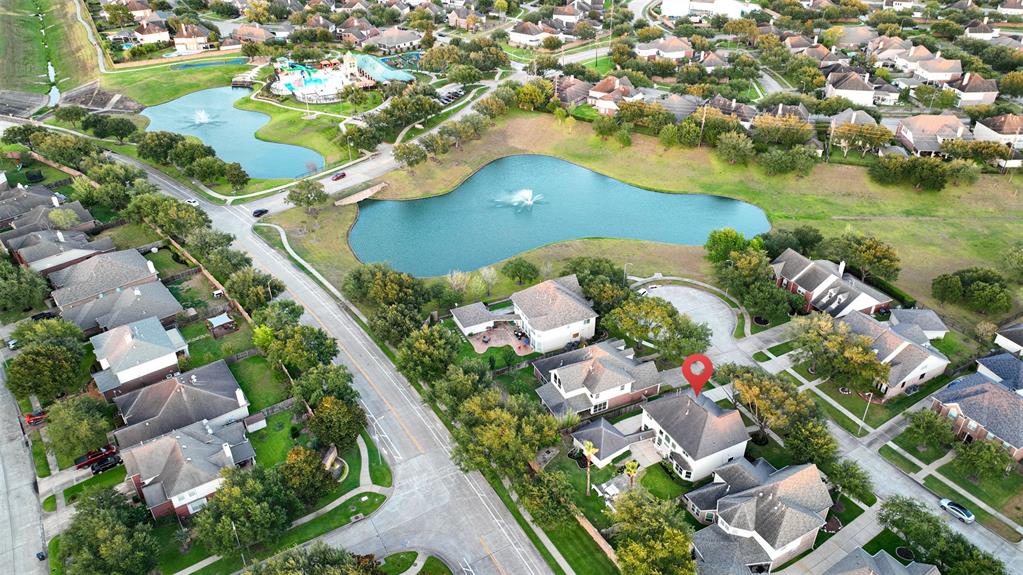
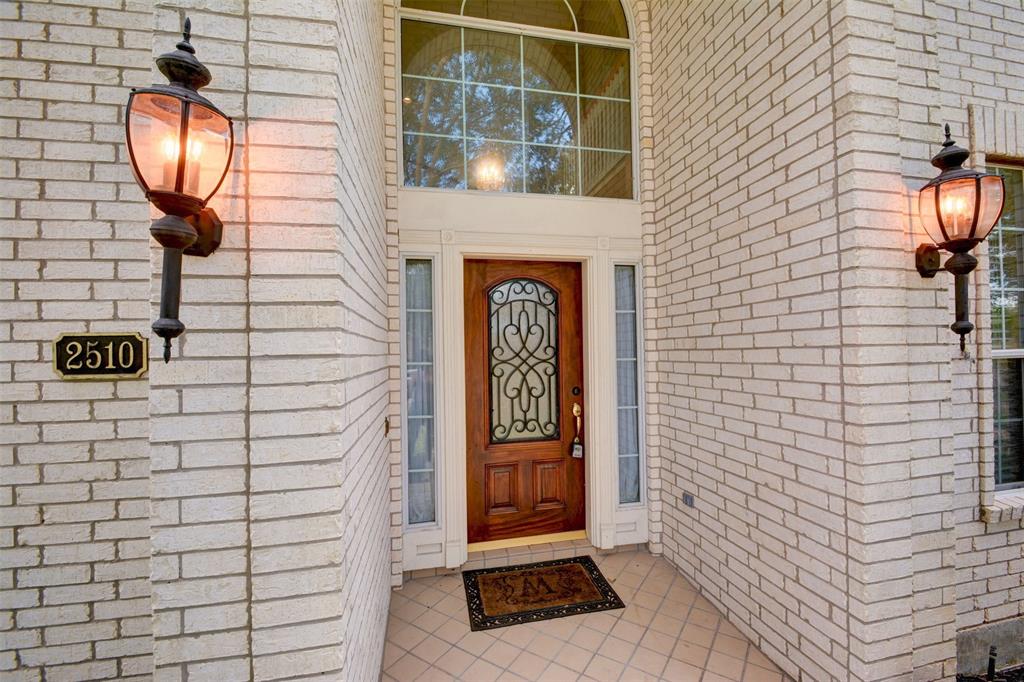
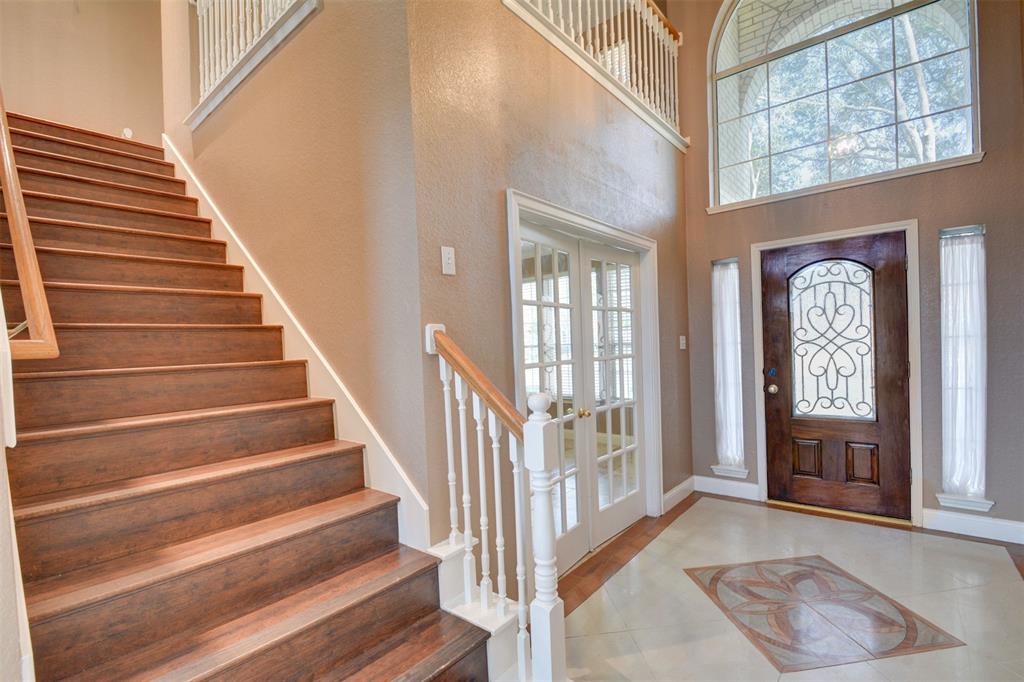
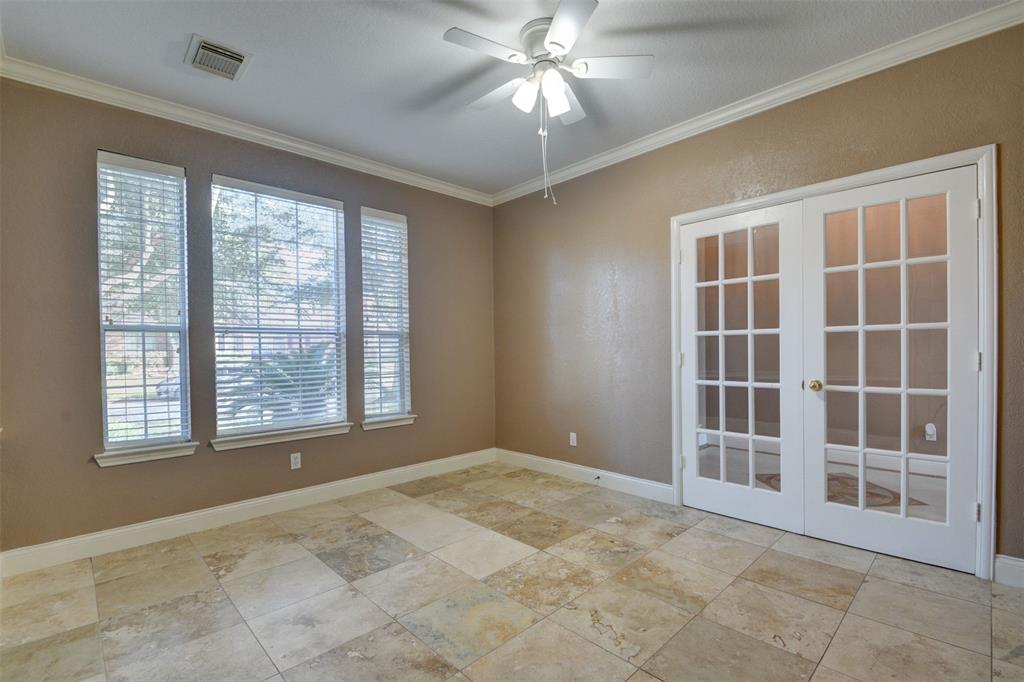
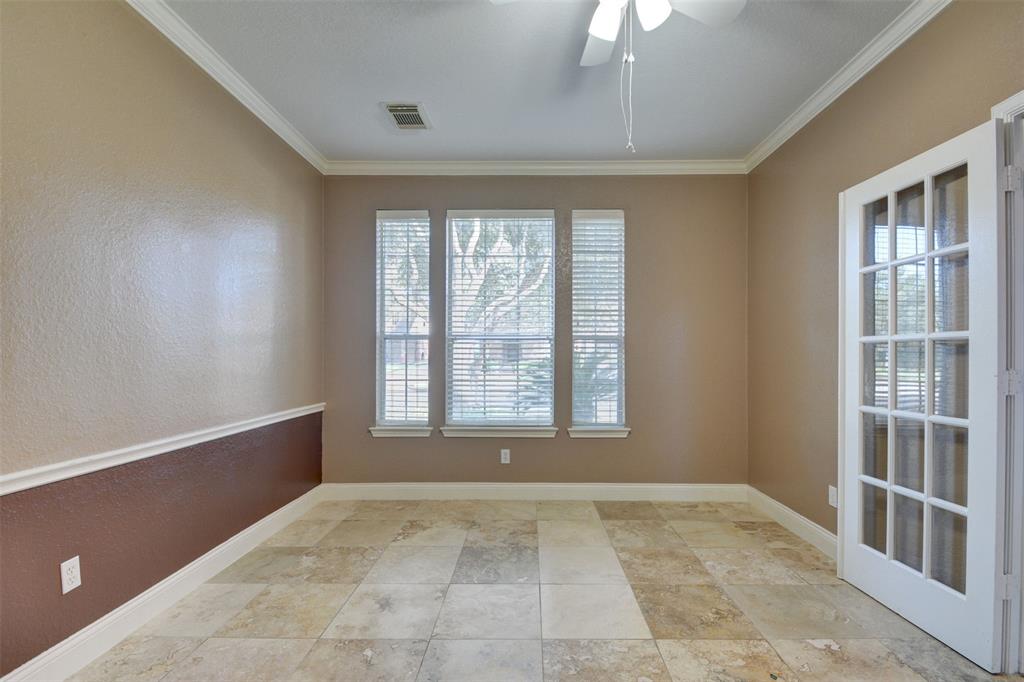
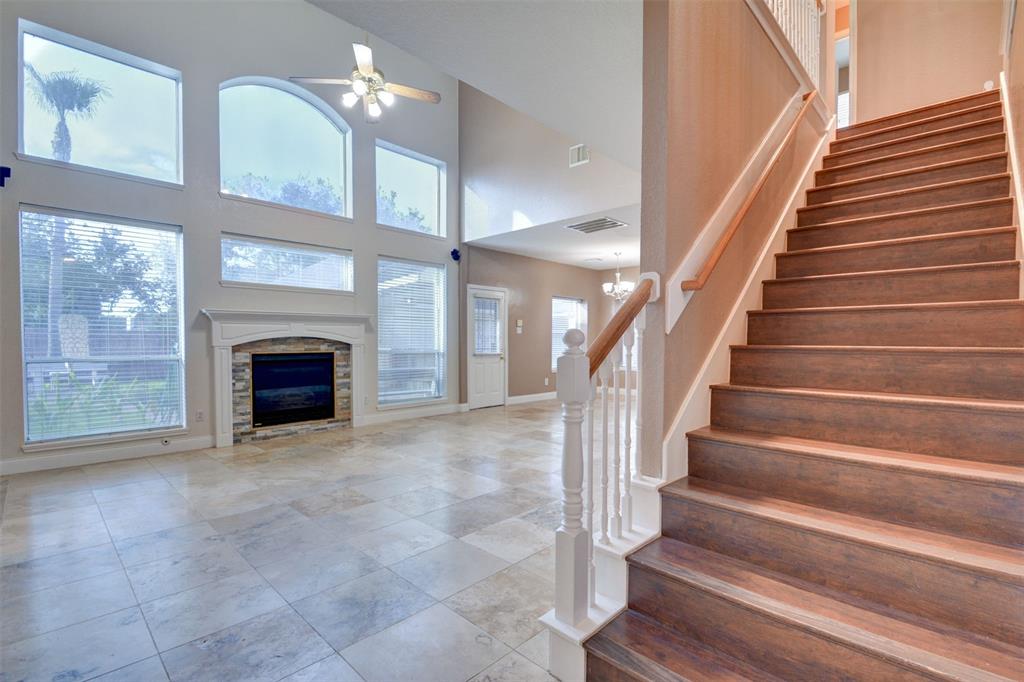
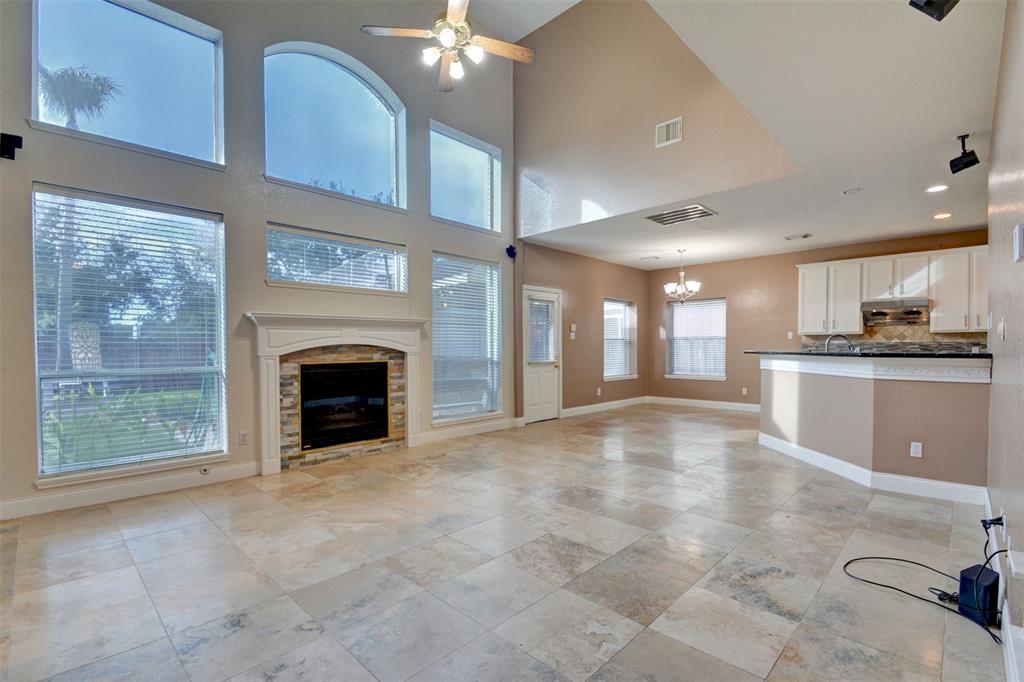
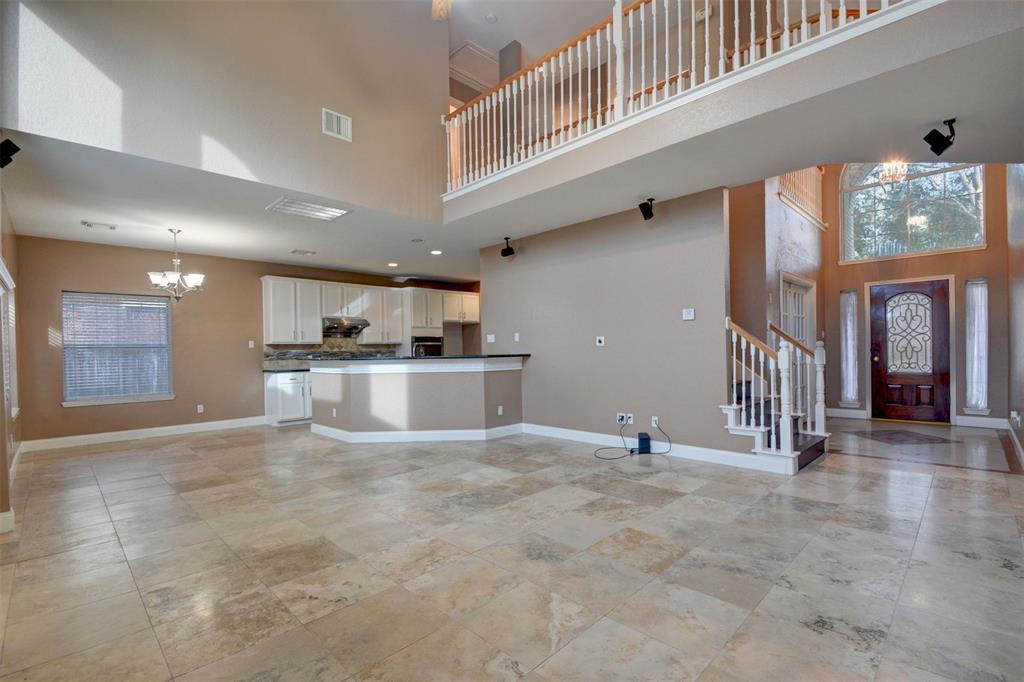
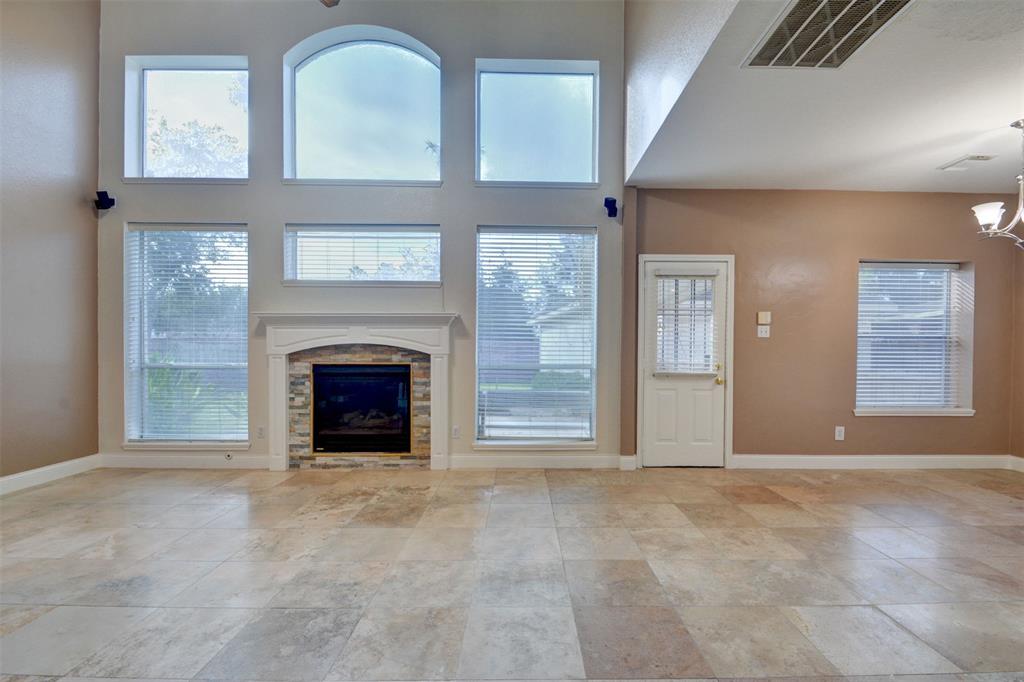
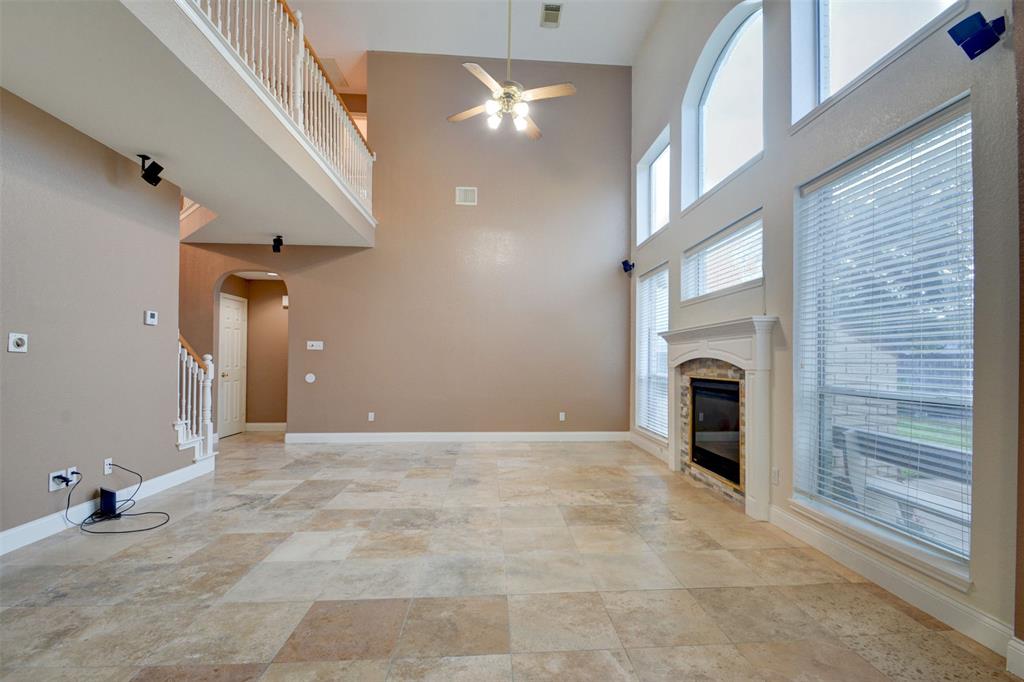
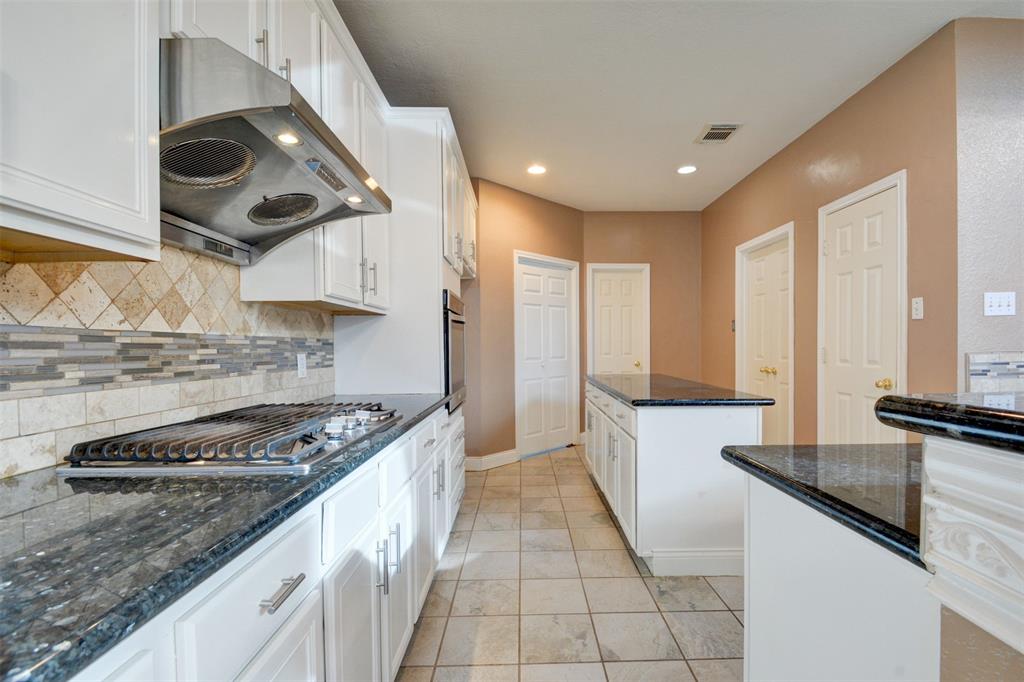
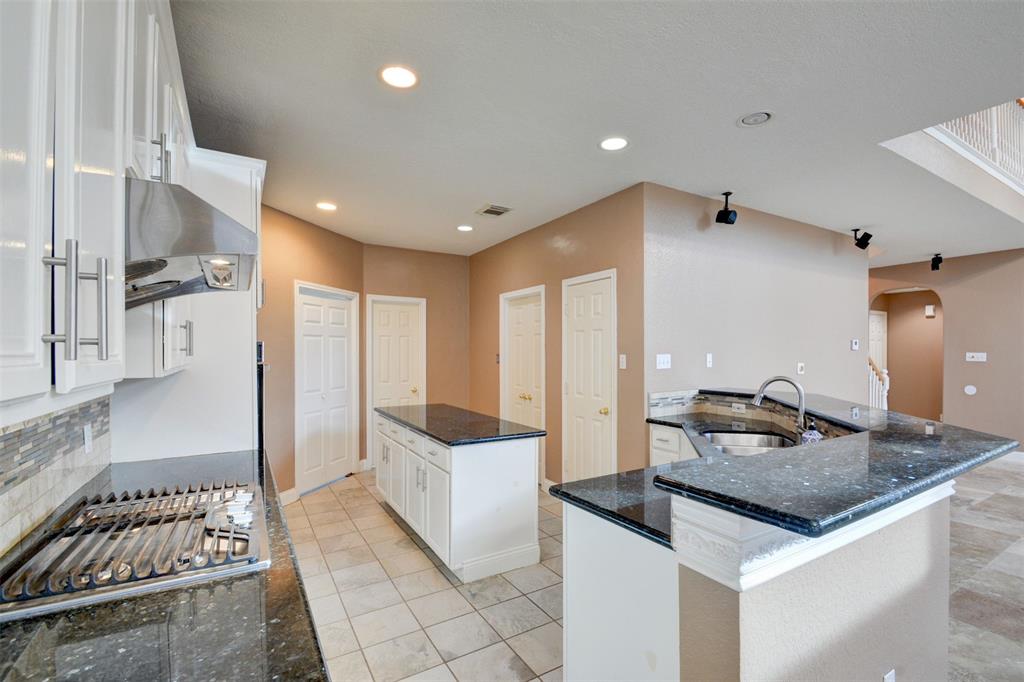
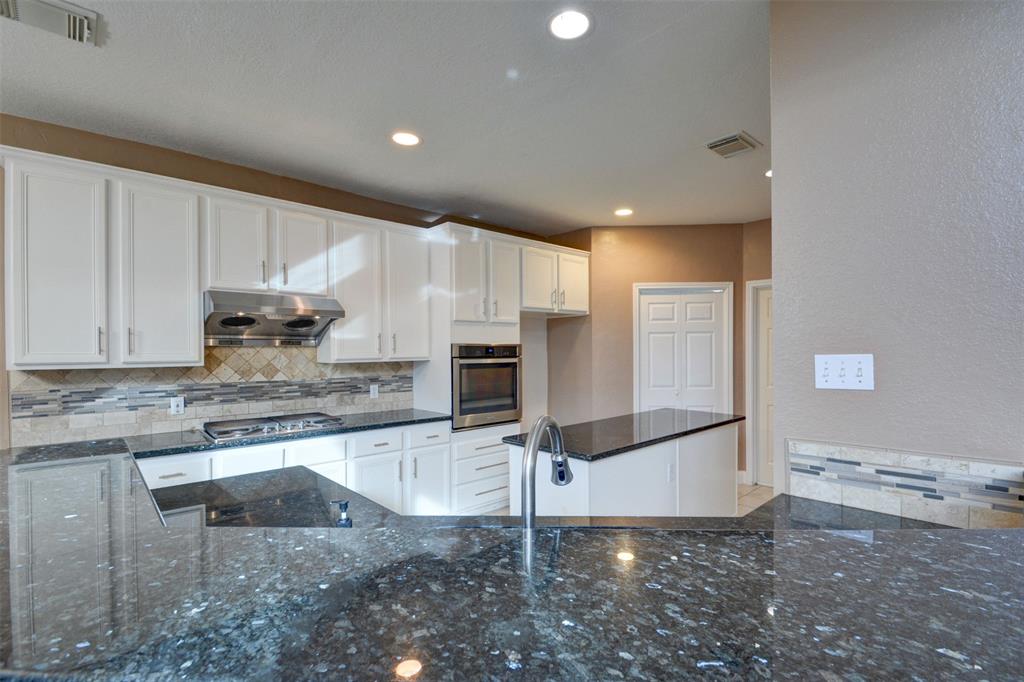
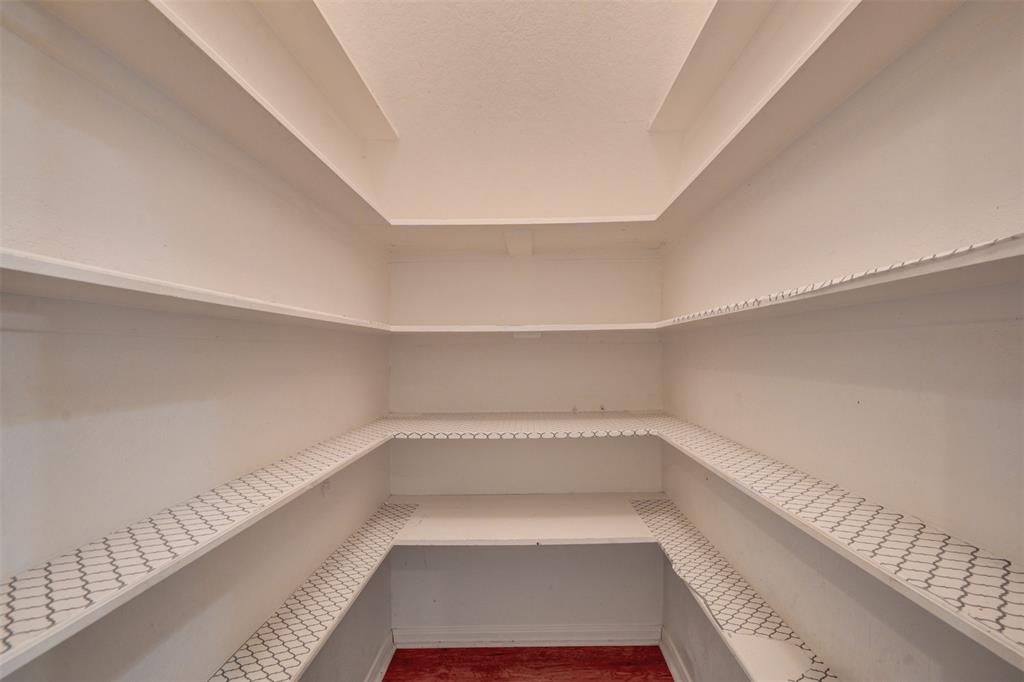
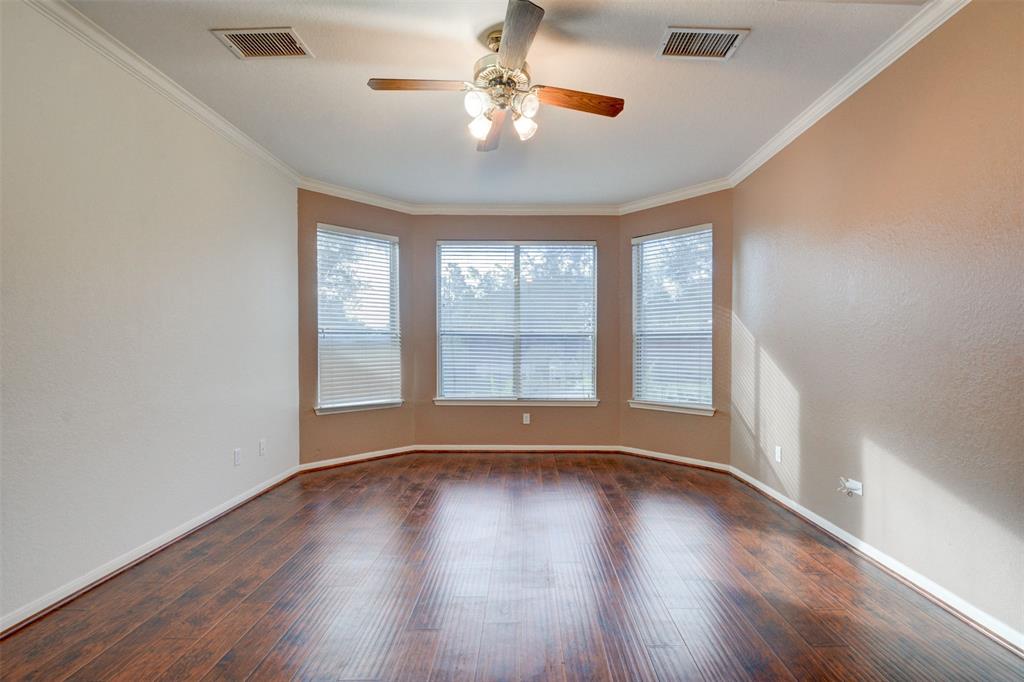
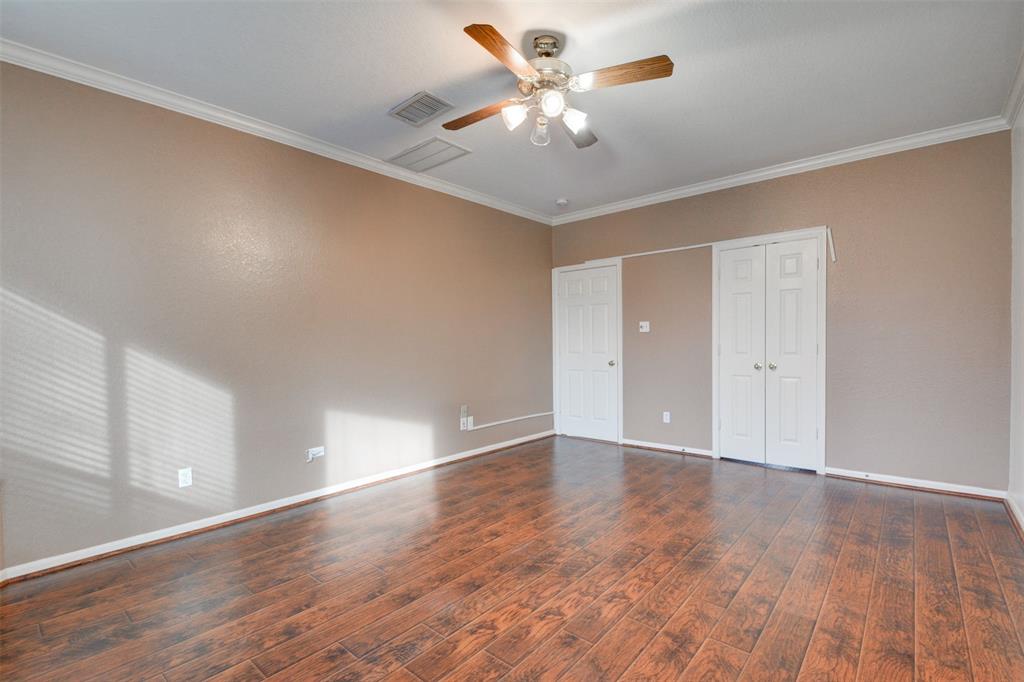
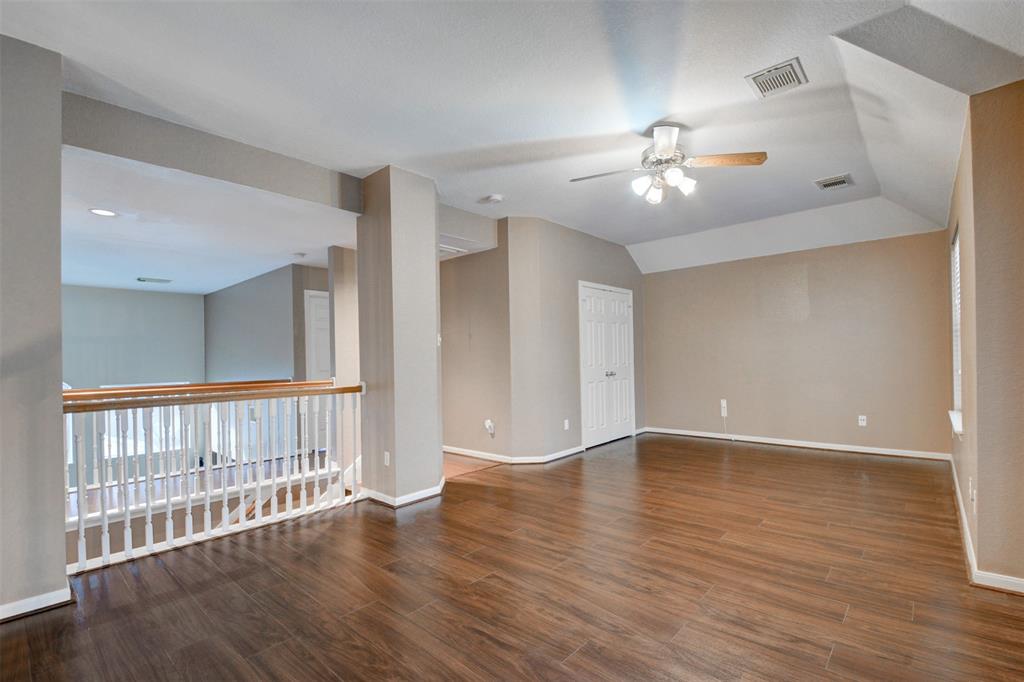
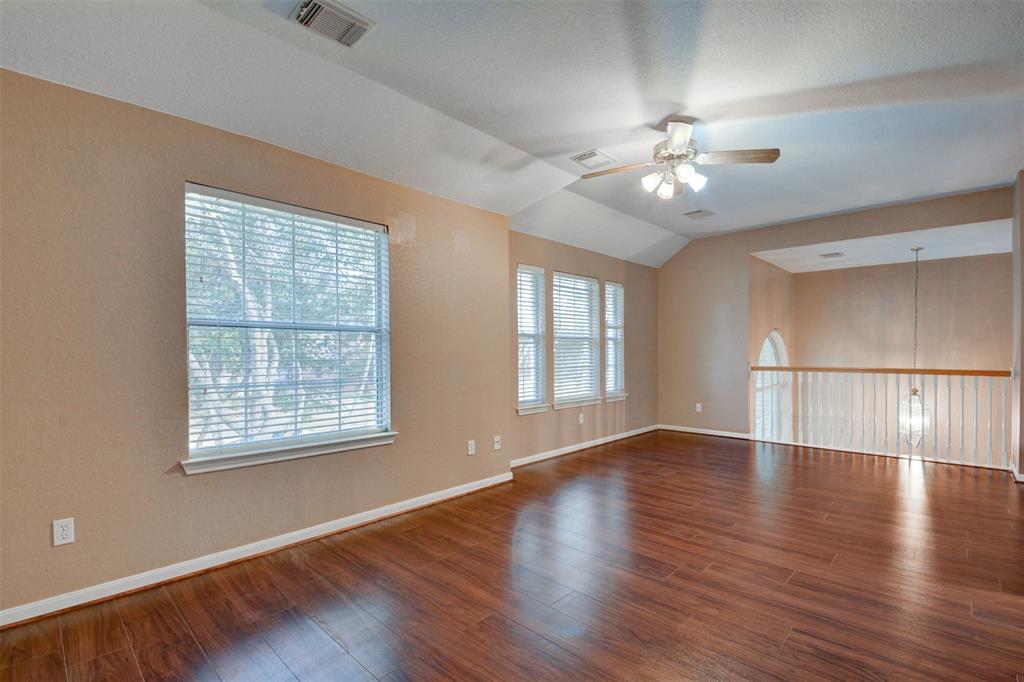
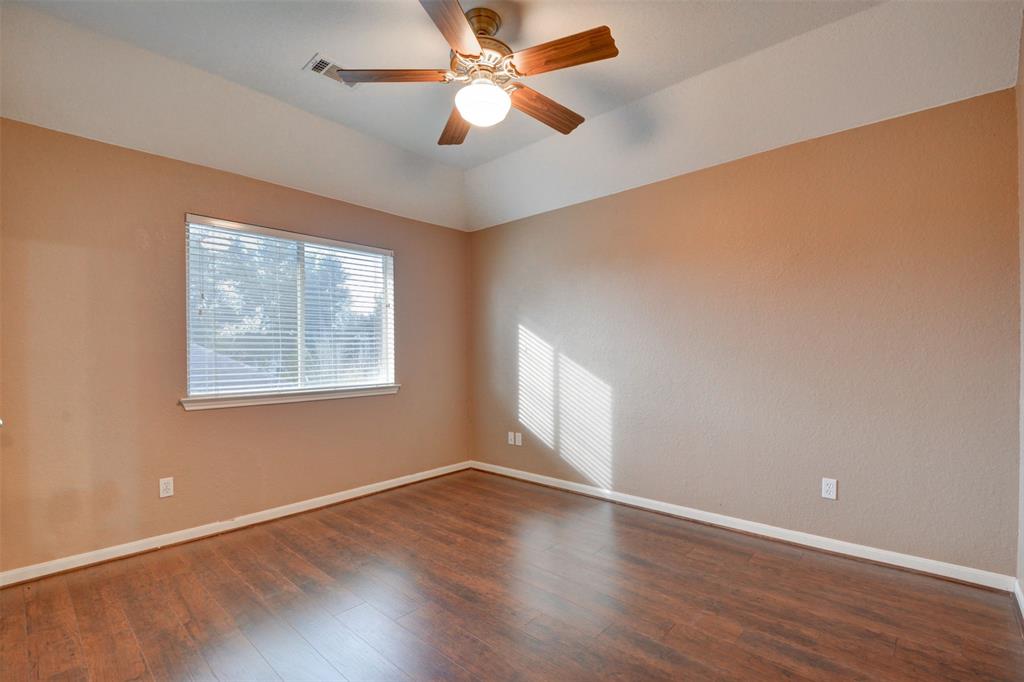
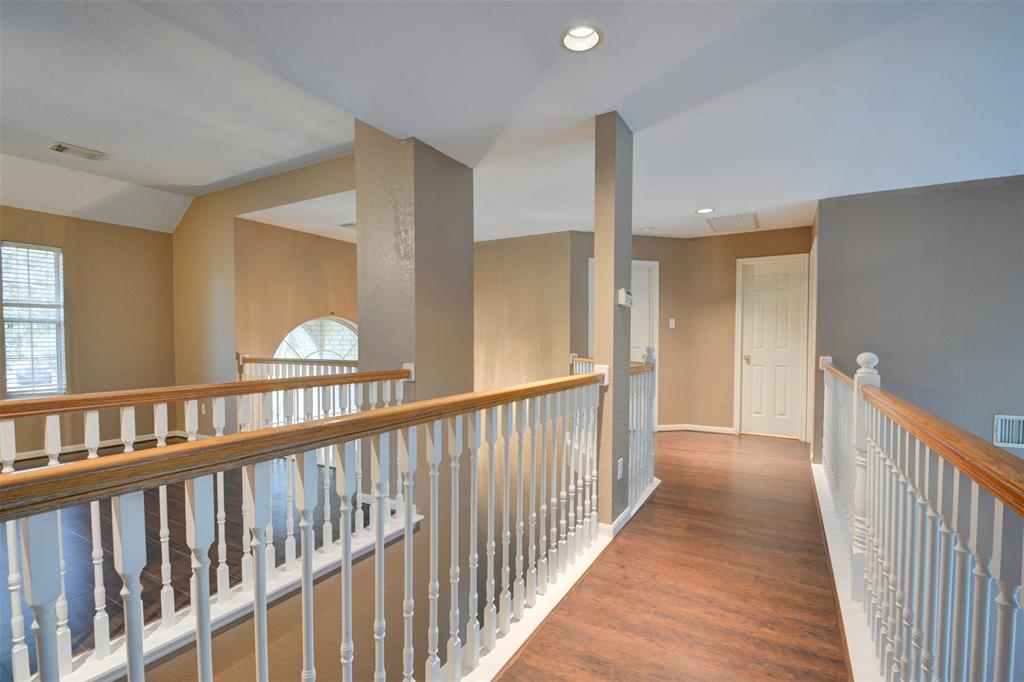
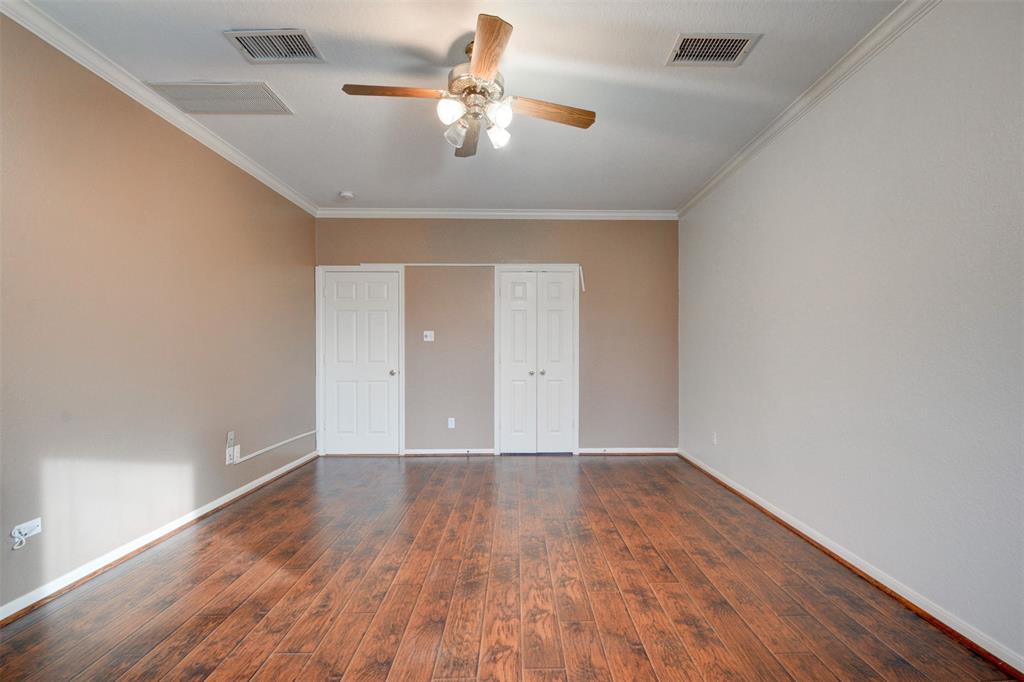
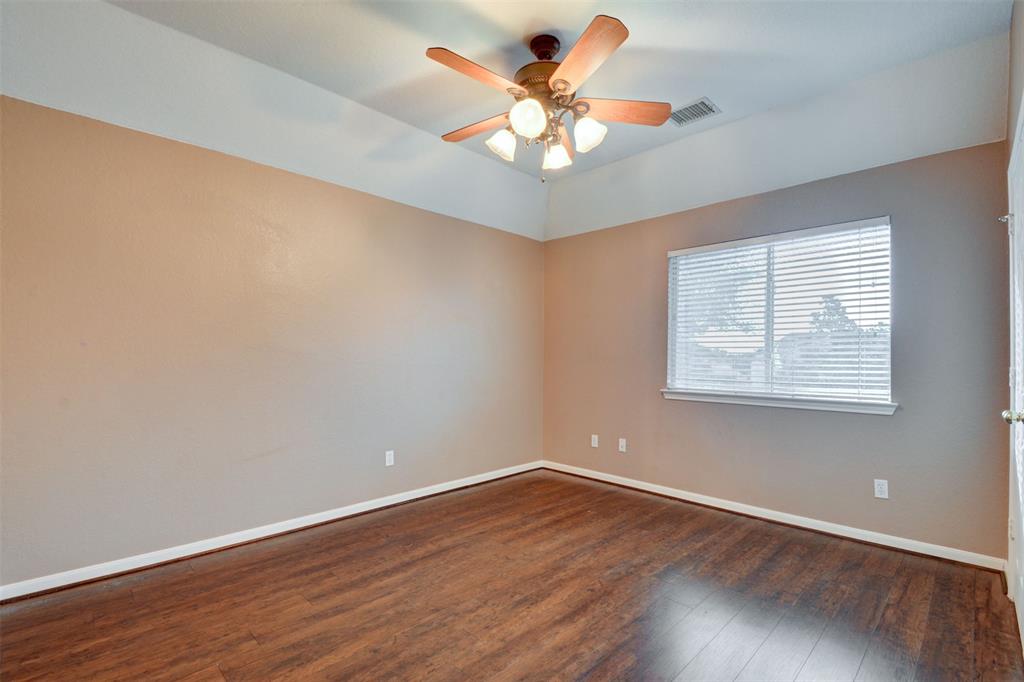
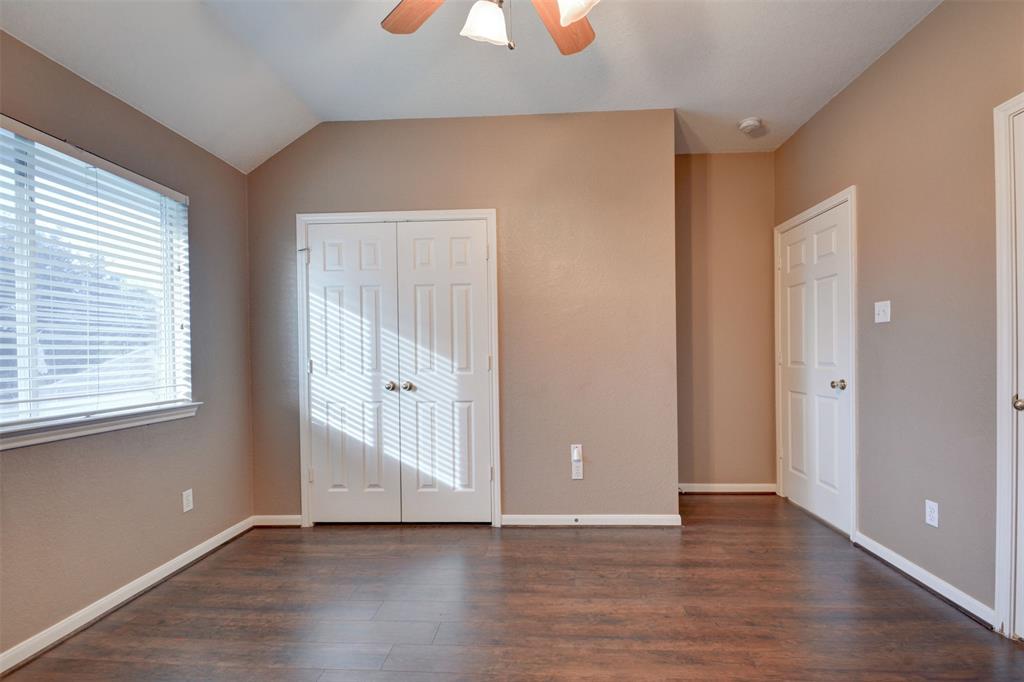
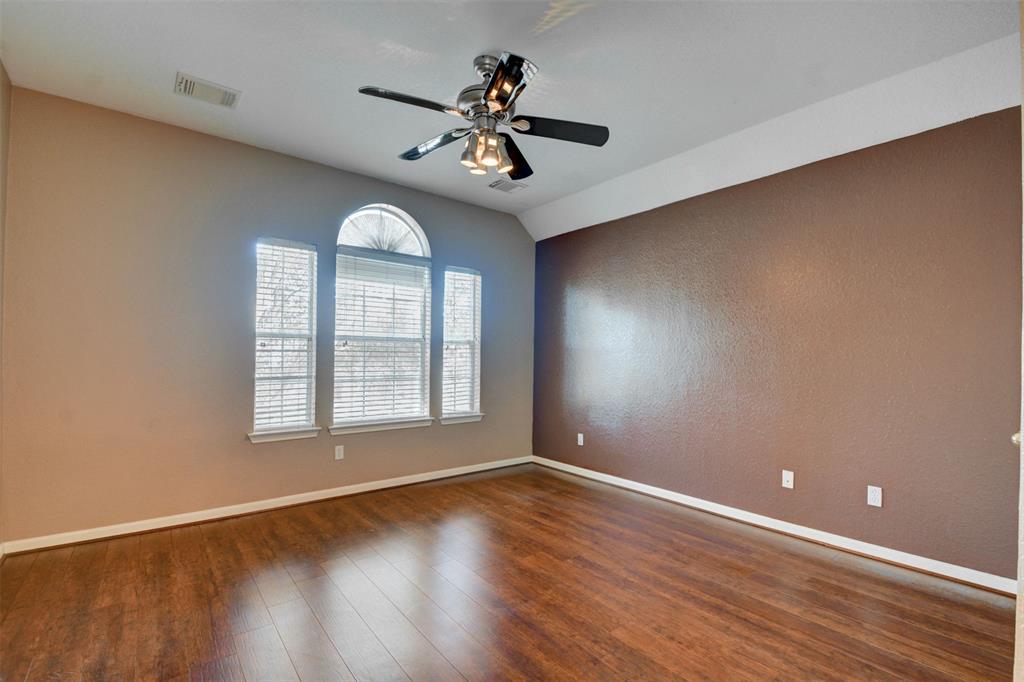
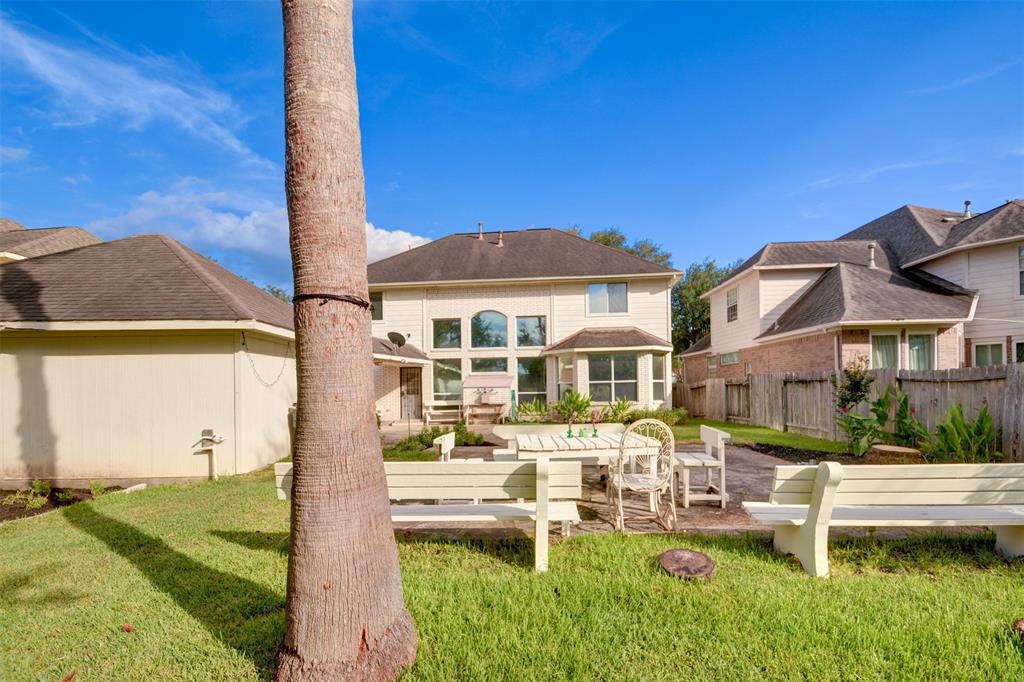
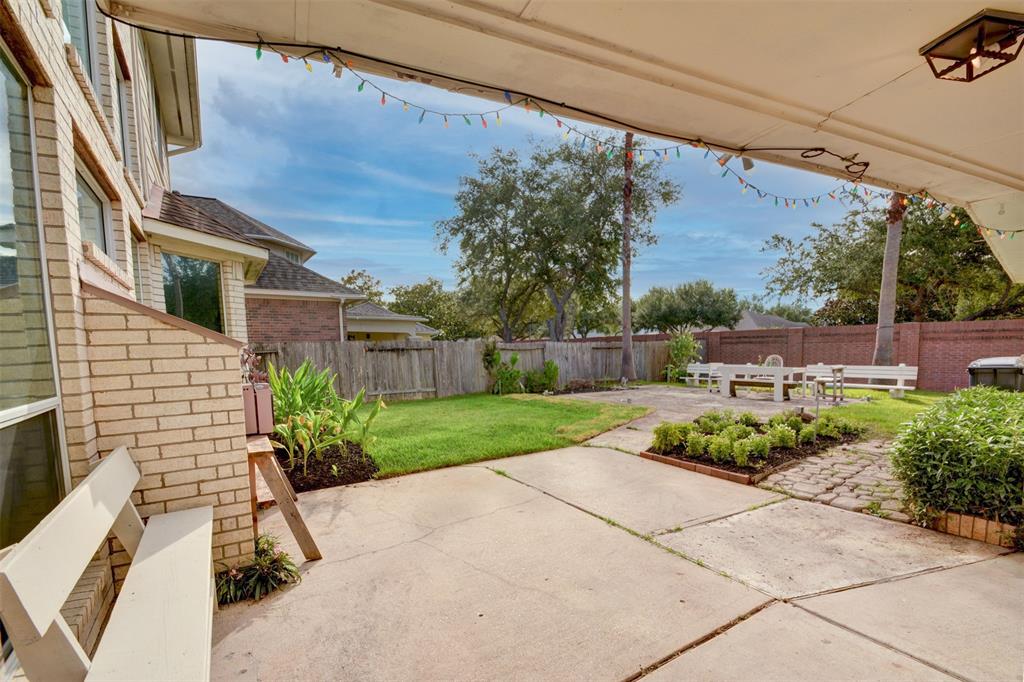
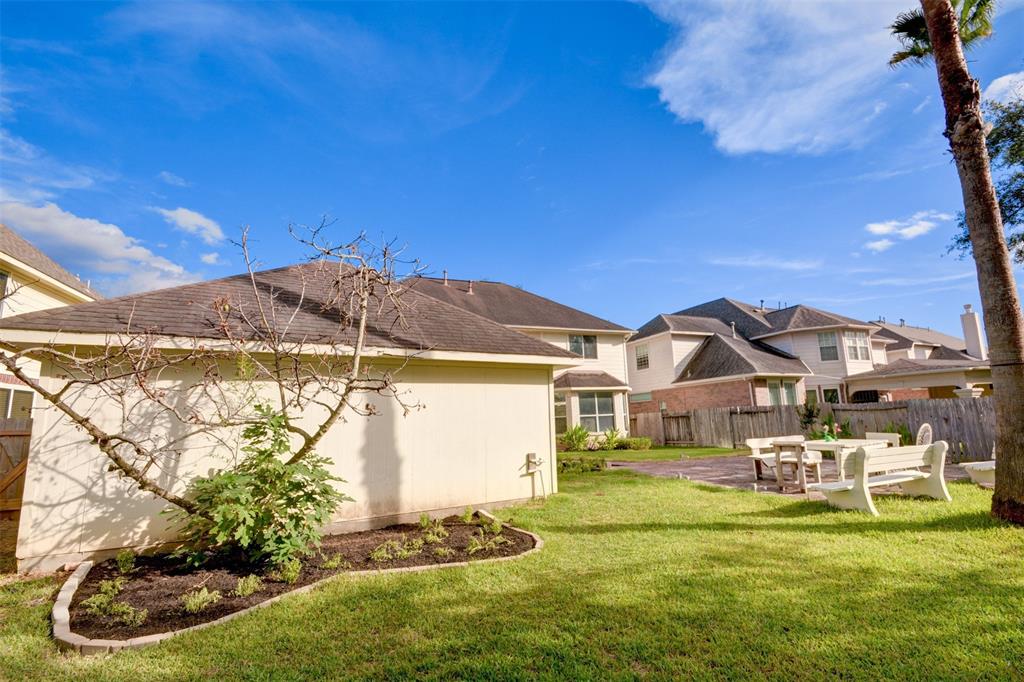
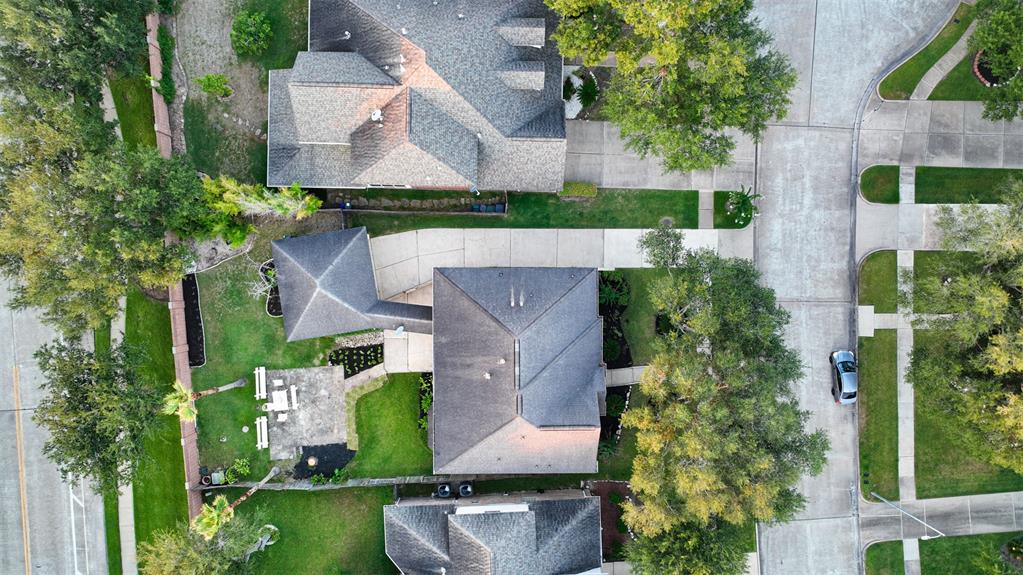
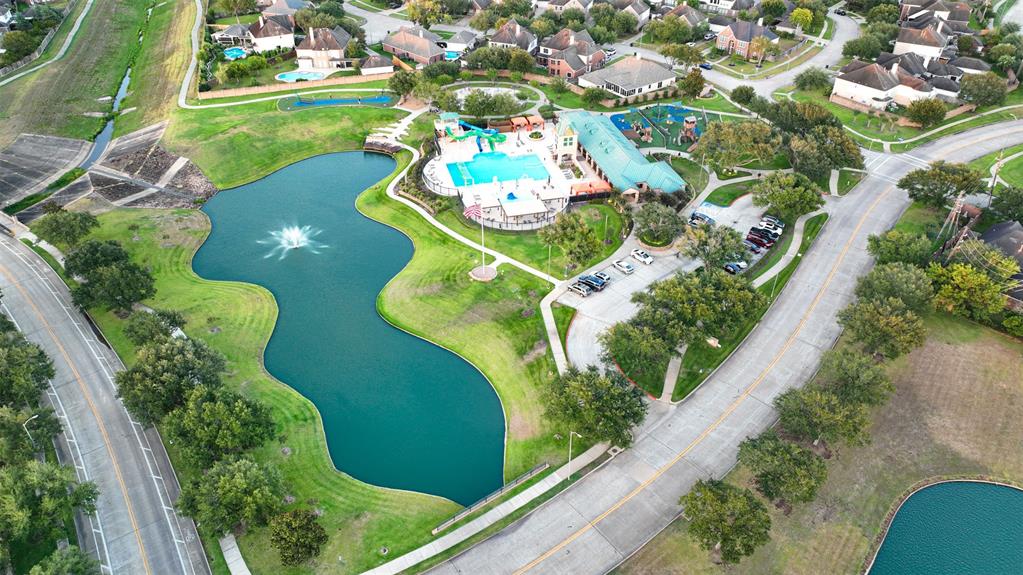
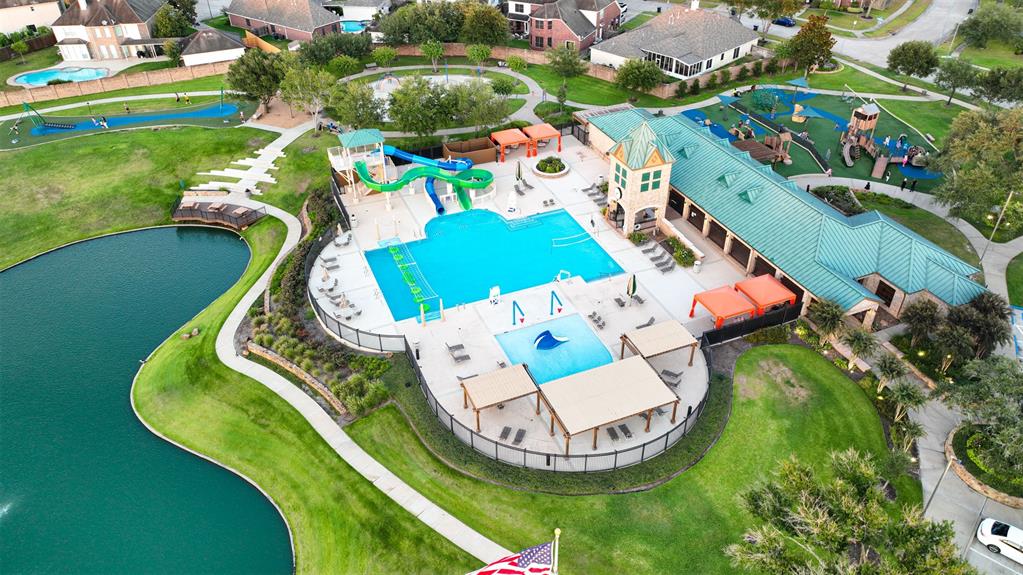
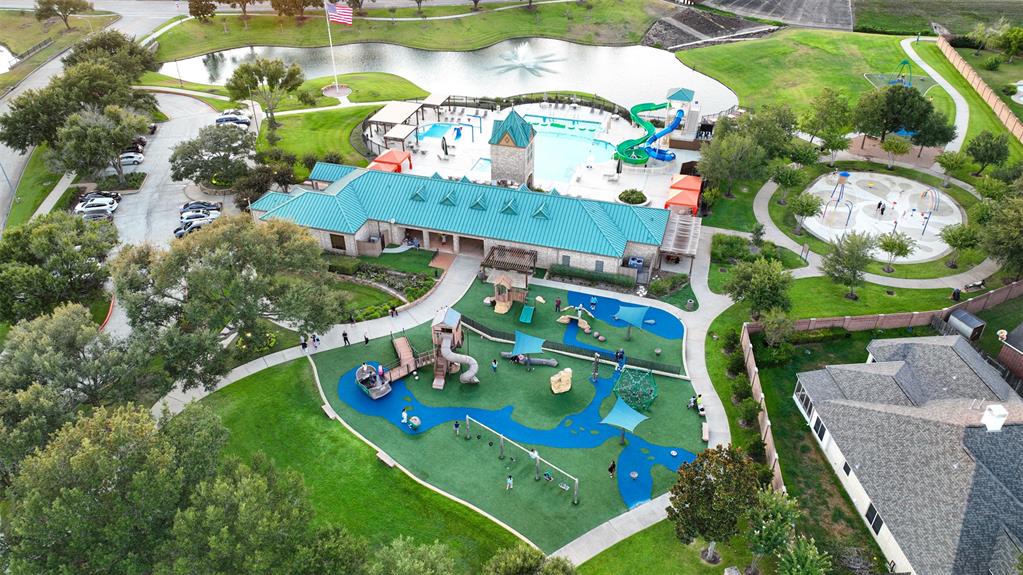
SPECTACULAR, Beautiful Home nestled in the Sugarland area features 4 bedrooms, 3.5 bathrooms, detached garage with covered walk, high ceilings, formal dining/study, spacious kitchen with breakfast bar, 42 Maple cabinets and a walk in pantry, stunning loft views huge upstairs game room. You don't want to miss out on this one! Close to restaurants & shopping! Exellent location!
Premium Content
Get full access to Premium Content
Sold Price for nearby listings,
Property History Reports and more.
Sign Up or
Log In Now
General Description
Sold Price Range:
$370,001 - $420,000
Address:
2510 Bridge Hampton Way
Legal Description:
RIVERPARK SEC 3 R/P, BLOCK 1, LOT 10
Property Type:
Single-Family
Baths:
3 Full & 1 Half Bath(s)
Year Built:
1999 / Appraisal District
Building Sqft.:
2,686 250(m²) /Appraisal District
Lot Size:
8,417 Sqft. 782(m²) /Appraisal District
Maintenance Fee:
$ 895 / Annually
Master Planned Community:
River Park
Room Dimension
Primary Bedroom:
18 x 13, 1st
Interior Features
Kitchen Description:
Breakfast Bar, Island w/ Cooktop, Kitchen open to Family Room, Pantry
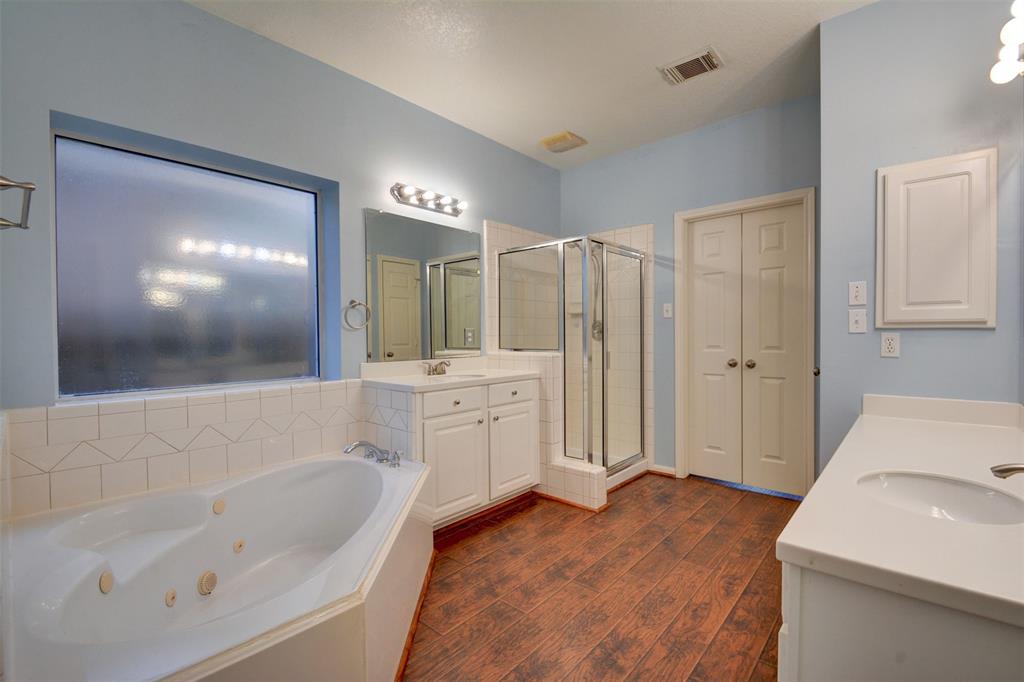
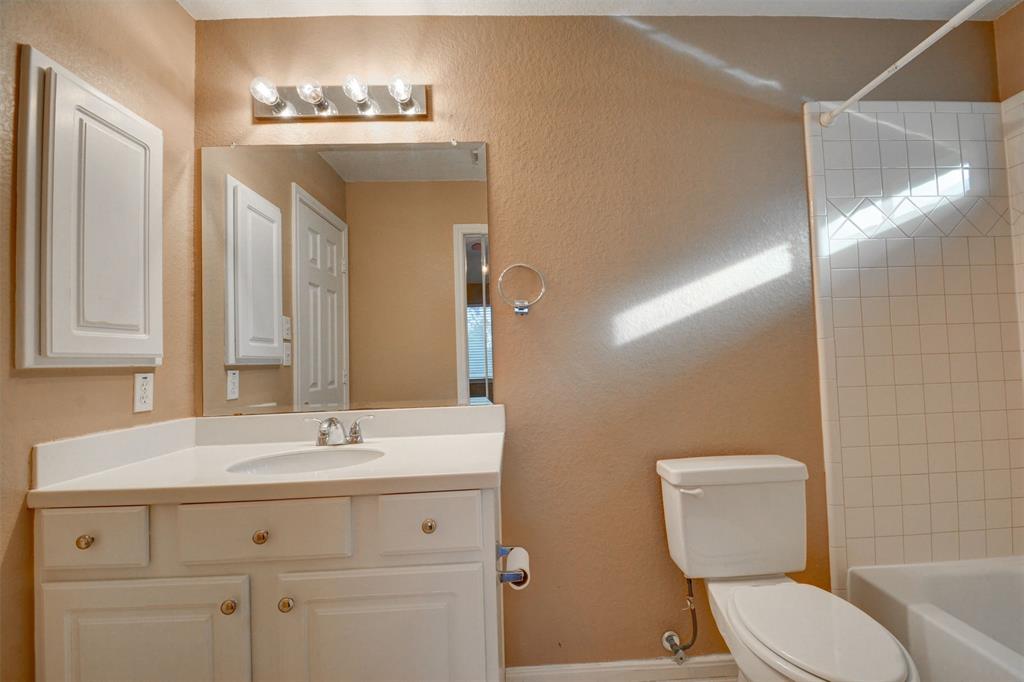
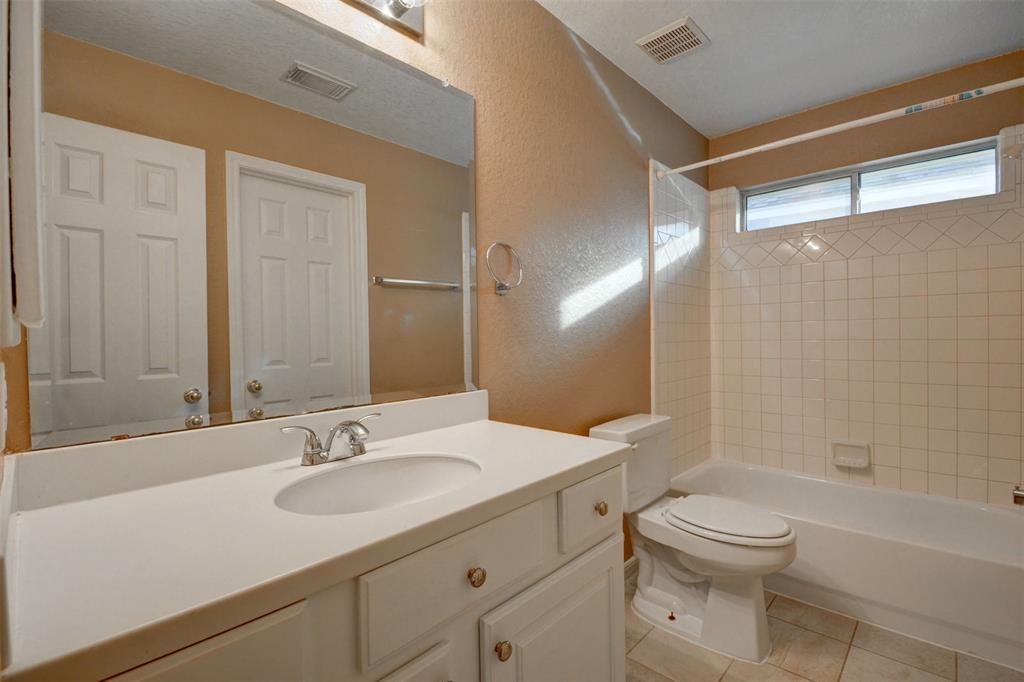
Bathroom Description:
Primary Bath: Double Sinks, Primary Bath: Separate Shower
Cooling:
Central Electric
Exterior Features
Water Sewer:
Public Sewer, Public Water
Assigned School Information
School information is computer generated and may not be accurate or current. Buyer must independently verify and confirm enrollment. Please contact the school district to determine the schools to which this property is zoned.
Listing Broker: NB Elite Realty
Email Listing Broker
Selling Broker: Redfin Corporation
Last updated as of: 06/30/2024
Property Tax
Market Value Per Appraisal District
Cost/Sqft based on Market Value
Tax Year
Cost/sqft
Market Value
Change
Tax Assessment
Change
2023
$132.28
$355,311
9.90% $355,311
28.65%
2022
$120.36
$323,290
28.76% $276,190
10.00%
2021
$93.48
$251,080
3.62% $251,080
3.62%
2020
$90.21
$242,300
-0.36% $242,300
-0.36%
2019
$90.53
$243,170
2.56% $243,170
2.56%
2018
$88.27
$237,090
3.55% $237,090
3.55%
2017
$85.24
$228,960
-2.99% $228,960
-1.55%
2016
$87.87
$236,020
6.79% $232,560
10.00%
2015
$82.29
$221,020
14.99% $211,420
10.00%
2014
$71.56
$192,200
3.62% $192,200
3.62%
2013
$69.06
$185,490
$185,490
2023 Fort Bend County Appraisal District Tax Value
Market Land Value:
$43,165
Market Improvement Value:
$312,146
Total Market Value : $355,311
2023 Tax Rates
LAMAR CISD:
1.1492 %
FT BEND CO GEN:
0.4265 %
FORT BEND DRNG:
0.0124 %
CITY OF SUGAR LAND:
0.3500 %
FT BEND LID 10:
0.5700 %
Total Tax Rate : 2.5081 %